Fig. 10

Download original image
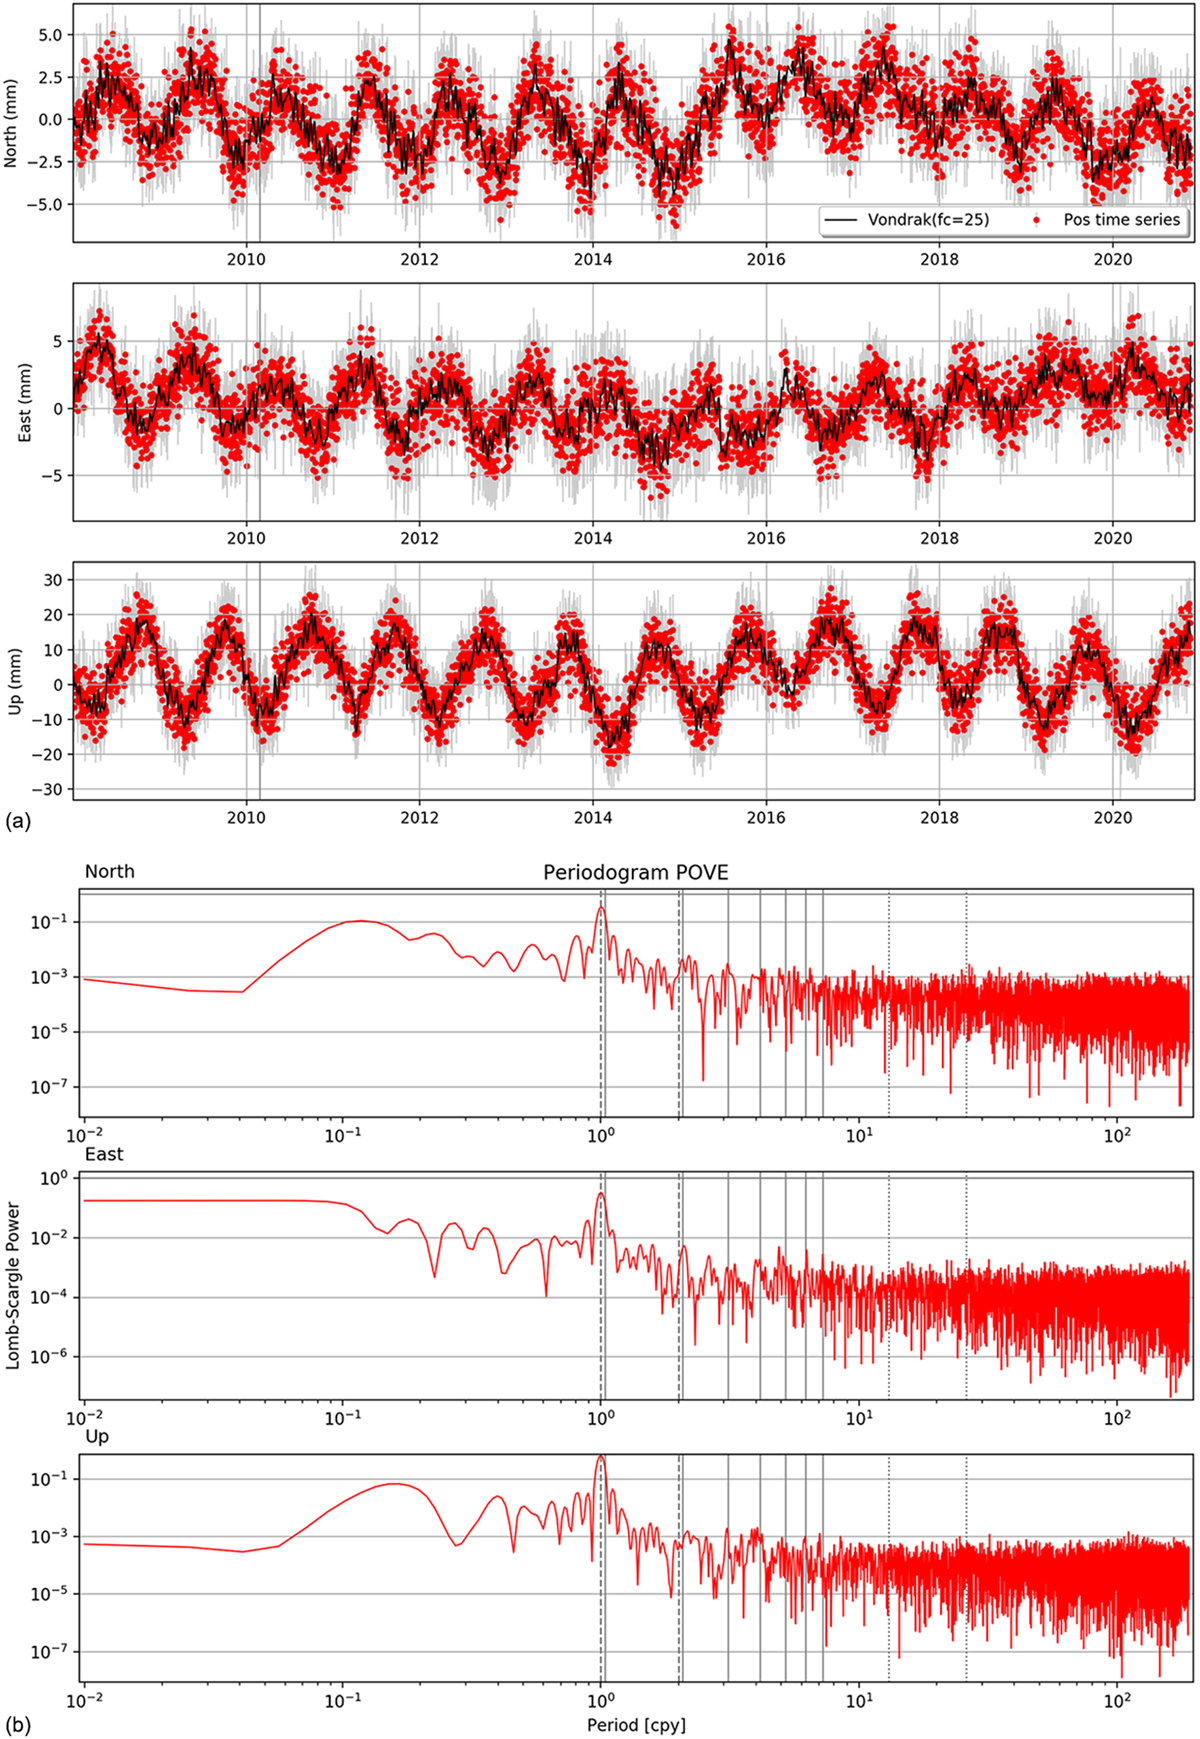
Seasonal deformation at station POVE. (a) North-East-Up components time series from our processing, detrended after outlier elimination. The time series are highlighted by a Vondrak filter of cutoff frequency 25 cpy (black line). (b) Lomb-scargle periodogram of the detrended and cleaned time series over the displayed period of observation. Expected periods are represented by the vertical line (gray dashed: annual and semi-annual period; gray solid: draconitic period and harmonics; dotted line: fortnightly tidal cycle and harmonic of ~ 14 and ~ 28 days). Location of POVE is depicted in Figure 1.
Current usage metrics show cumulative count of Article Views (full-text article views including HTML views, PDF and ePub downloads, according to the available data) and Abstracts Views on Vision4Press platform.
Data correspond to usage on the plateform after 2015. The current usage metrics is available 48-96 hours after online publication and is updated daily on week days.
Initial download of the metrics may take a while.


