Fig. 6

Download original image
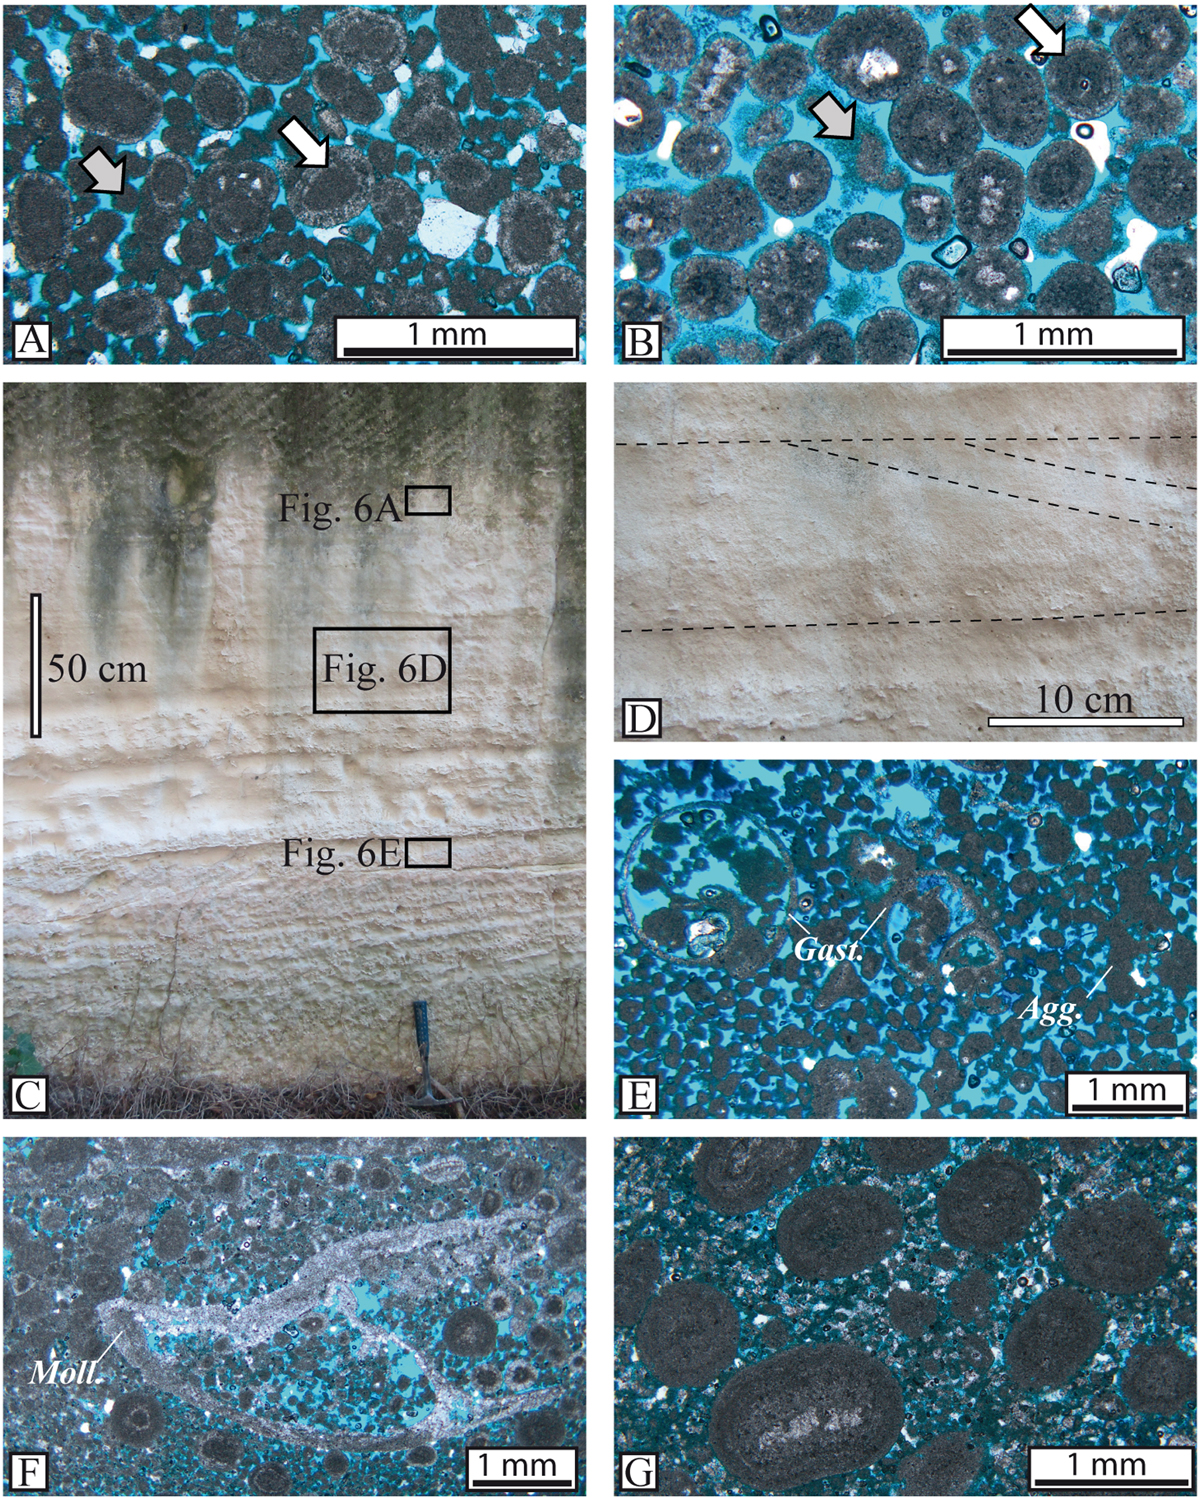
Oolitic-peloidal and peloidal grainstones facies (F1). A-B-E-F-G) Thin section microphotographs under plane polarized light; C-D: Field photographs. A) Oolitic-peloidal grainstone (Facies F1A) showing a mixture of ooids (white arrow) and peloids (grey arrow). Note the bimodal distribution of grains: the medium-sized grains include superficial, radiaxial and strongly micritized ooids while the peloids are the finer (around 0.1–0.2 mm size) and structureless grains. The nuclei of the ooids are essentially made of peloids. B) Well-sorted oolitic-peloidal grainstone displays abundant radiaxial ooids (white arrow) and few peloids (grey arrow). The nuclei of the ooids consist of quartz grains or bioclasts. Note the high amount of intergranular porosity and the almost lack of compaction features. C) Field photograph of the southern face of the quarry showing a massive bed of oolitic peloidal grainstones with decimetre-thick, gravelly fossiliferous lenses. Cross-stratifications are seldom visible (see Fig.6D). D) Close-up view of sub-planar cross-stratification from the oolitic-peloidal grainstones indicated by the dotted lines. The cross-beddings heights range between 10 and 50 cm. E) Peloidal grainstones with scattered molluscs (F1B facies) displaying slightly elongated peloids, micritized molluscan shells (mainly gastropods: Gast .) and few aggregate grains ( Agg .). F) Oncoidal-ooidal rich peloidal grainstones (F1C facies) are poorly sorted sands consisting of a mixture of peloids and coarse grains (coated grains and molluscans). Note the strong micritization of the molluscan shells ( Moll .). G) F1C facies displays bimodal distribution made of millimetric coated grains (ooids and/or oncoids) floating in a peloidal sand matrix: F1C facies occurs generally within few centimetres thick lenses.
Current usage metrics show cumulative count of Article Views (full-text article views including HTML views, PDF and ePub downloads, according to the available data) and Abstracts Views on Vision4Press platform.
Data correspond to usage on the plateform after 2015. The current usage metrics is available 48-96 hours after online publication and is updated daily on week days.
Initial download of the metrics may take a while.


