")
")
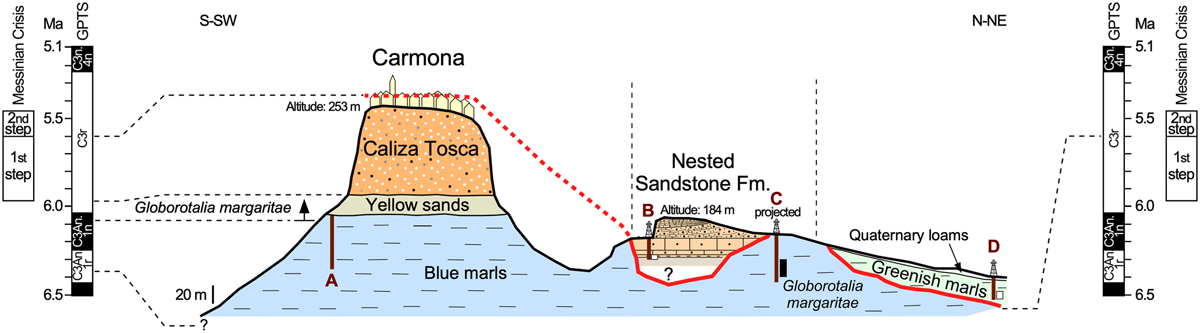
Fig. 5
Download original image
Morphologically and chronologically interpreted cross-section of the Carmona area including the exposed studied section A and the three cored boreholes (B–D) with biostratigraphic and paleomagnetic information (white: reverse polarity; black: normal polarity). Red (dotted or continuous) line: inferred subaerial erosional surface. Vertical dotted lines: changes of direction of the broken line shown in Figure 4 B. Global polarity time scale (GPTS) from Ogg (2012).
Current usage metrics show cumulative count of Article Views (full-text article views including HTML views, PDF and ePub downloads, according to the available data) and Abstracts Views on Vision4Press platform.
Data correspond to usage on the plateform after 2015. The current usage metrics is available 48-96 hours after online publication and is updated daily on week days.
Initial download of the metrics may take a while.