")
")
Open Access
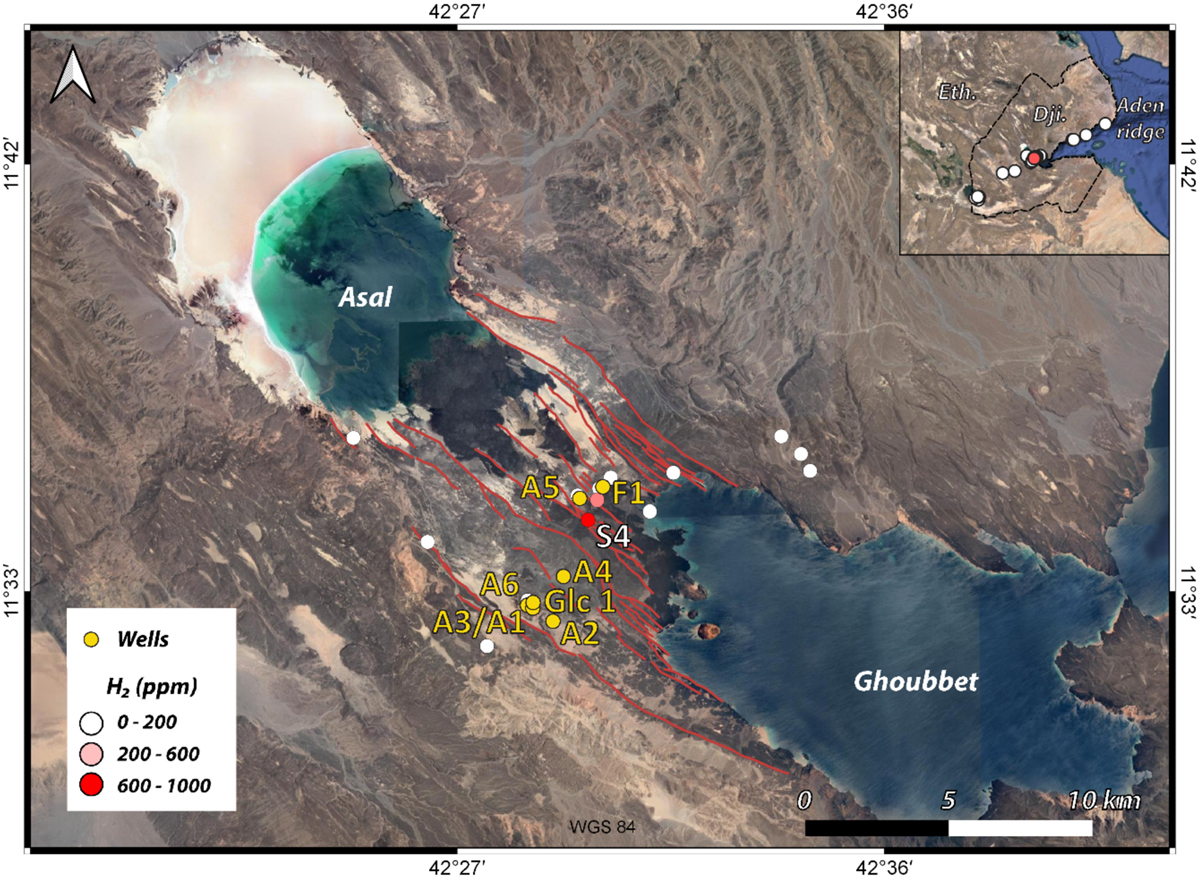
Fig. 2
Download original image
Map of the Asal–Ghoubbet rift showing major rift faults, geothermal wells, and surface H2 measurement points. The color scale from white to red indicates increasing H2 contents in fumaroles at the site. The red dot corresponds to site no. 4, presented in Figure 3.
Current usage metrics show cumulative count of Article Views (full-text article views including HTML views, PDF and ePub downloads, according to the available data) and Abstracts Views on Vision4Press platform.
Data correspond to usage on the plateform after 2015. The current usage metrics is available 48-96 hours after online publication and is updated daily on week days.
Initial download of the metrics may take a while.