")
")
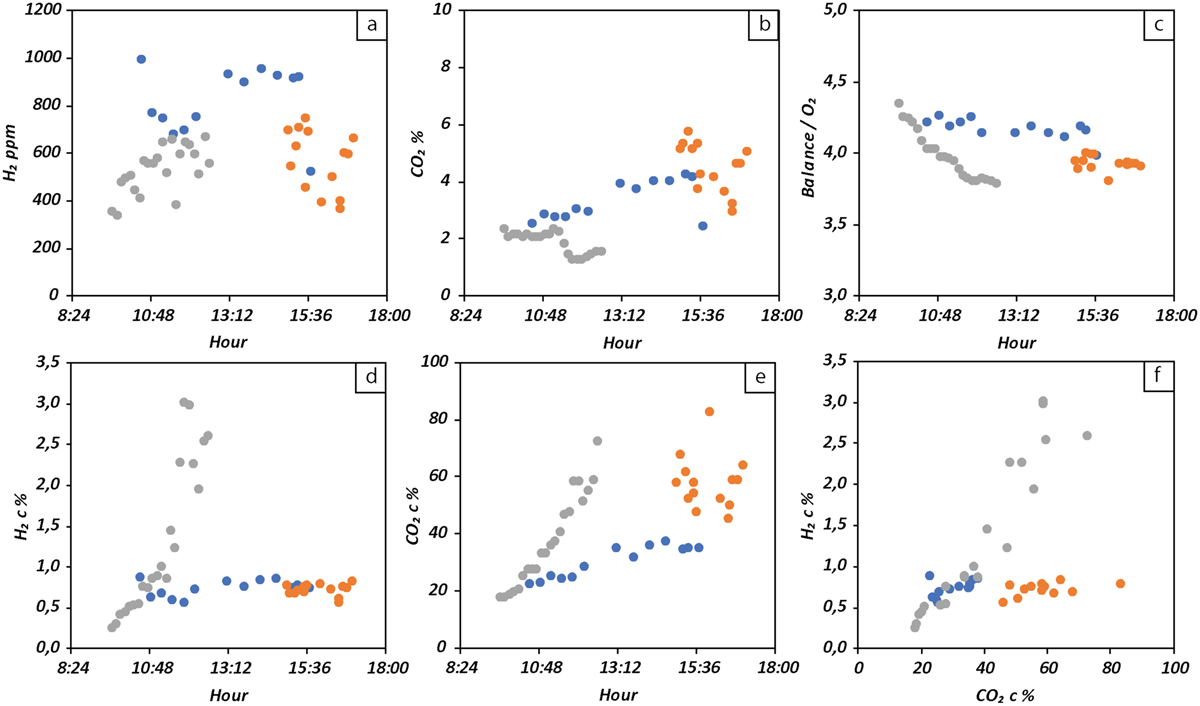
Fig. 4
Download original image
Evolution of gas content with time for the fumaroles of Site 4 within the Asal–Ghoubbet rift. Orange points 21/11/2019; blue points 12/08/2020; gray points 13/08/2020. (a) H2 (ppm) in situ as a function of time. (b) CO2 (%) in situ as a function of time. (c) Balance/O2 as a function of time for air variation in the analysis. (d) Diurnal variation in H2, after correction. (e) Diurnal variation in CO2, after correction. (f) Corrected H2 as a function of corrected CO2 (Pasquet et al., 2021).
Current usage metrics show cumulative count of Article Views (full-text article views including HTML views, PDF and ePub downloads, according to the available data) and Abstracts Views on Vision4Press platform.
Data correspond to usage on the plateform after 2015. The current usage metrics is available 48-96 hours after online publication and is updated daily on week days.
Initial download of the metrics may take a while.