")
")
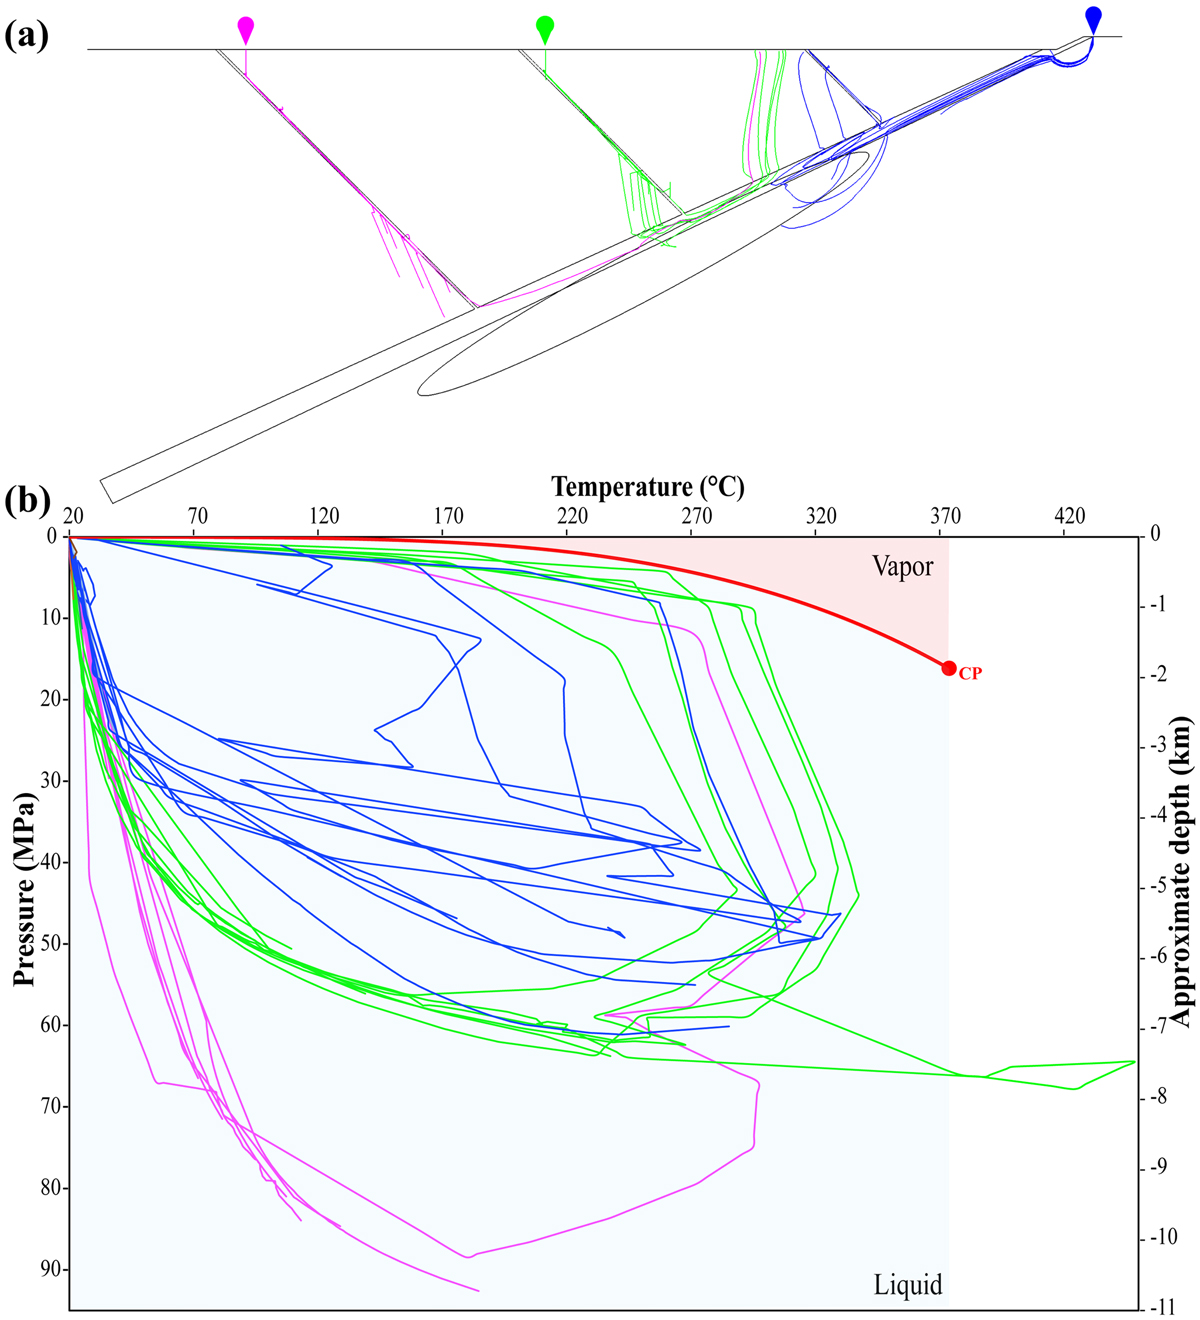
Fig. 10
Download original image
Tracking of fluid particles in (a) a schematic cross-section and in (b) a Pressure-Temperature diagram considering the model with a pluton dynamic permeability. The depth has been approximated following the hydrostatic pressure. The red curve delineates the vapor-liquid transition of pure water according to Cooper and Dooley (2007), with the critical point of pure water (CP) marked by a red dot.
Current usage metrics show cumulative count of Article Views (full-text article views including HTML views, PDF and ePub downloads, according to the available data) and Abstracts Views on Vision4Press platform.
Data correspond to usage on the plateform after 2015. The current usage metrics is available 48-96 hours after online publication and is updated daily on week days.
Initial download of the metrics may take a while.