")
")
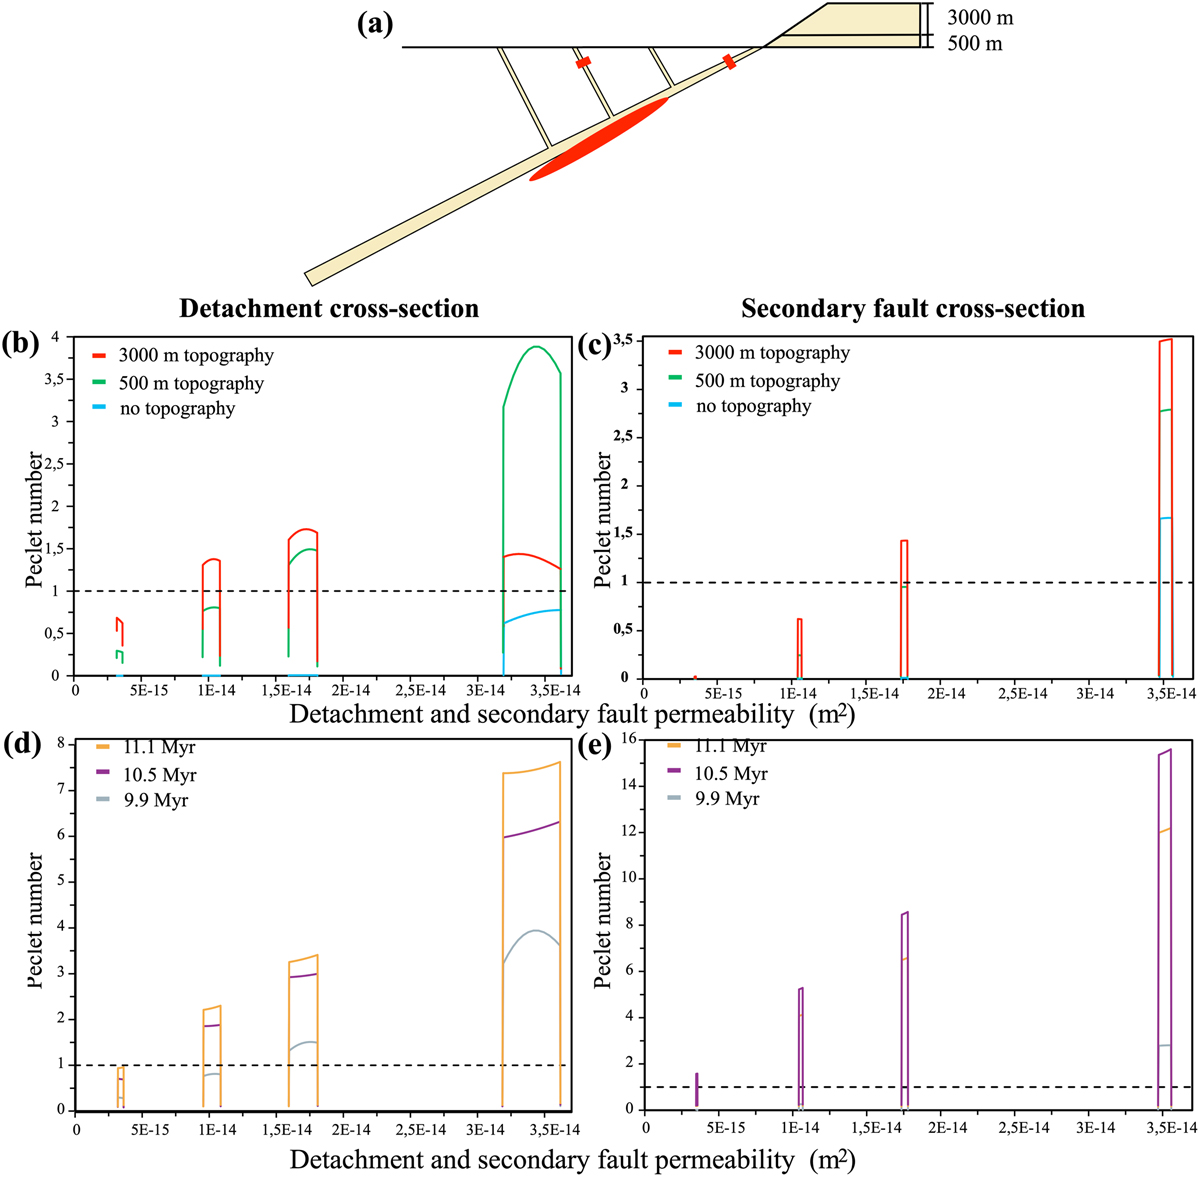
Fig. 9
Download original image
Pe number vs. detachment permeability models for the two cross-sections (localized as red lines in a). Panels on the left depict the detachment cross-section for the three tested topographies at the same moment (15 Myr, panel b) and for the first pluton position at three different instants (before, during and after its activity) with a topography of 500 m (panel d). On the right, panels c and e display the secondary fault cross-section with conditions identical to panels b and d, respectively.
Current usage metrics show cumulative count of Article Views (full-text article views including HTML views, PDF and ePub downloads, according to the available data) and Abstracts Views on Vision4Press platform.
Data correspond to usage on the plateform after 2015. The current usage metrics is available 48-96 hours after online publication and is updated daily on week days.
Initial download of the metrics may take a while.