")
")
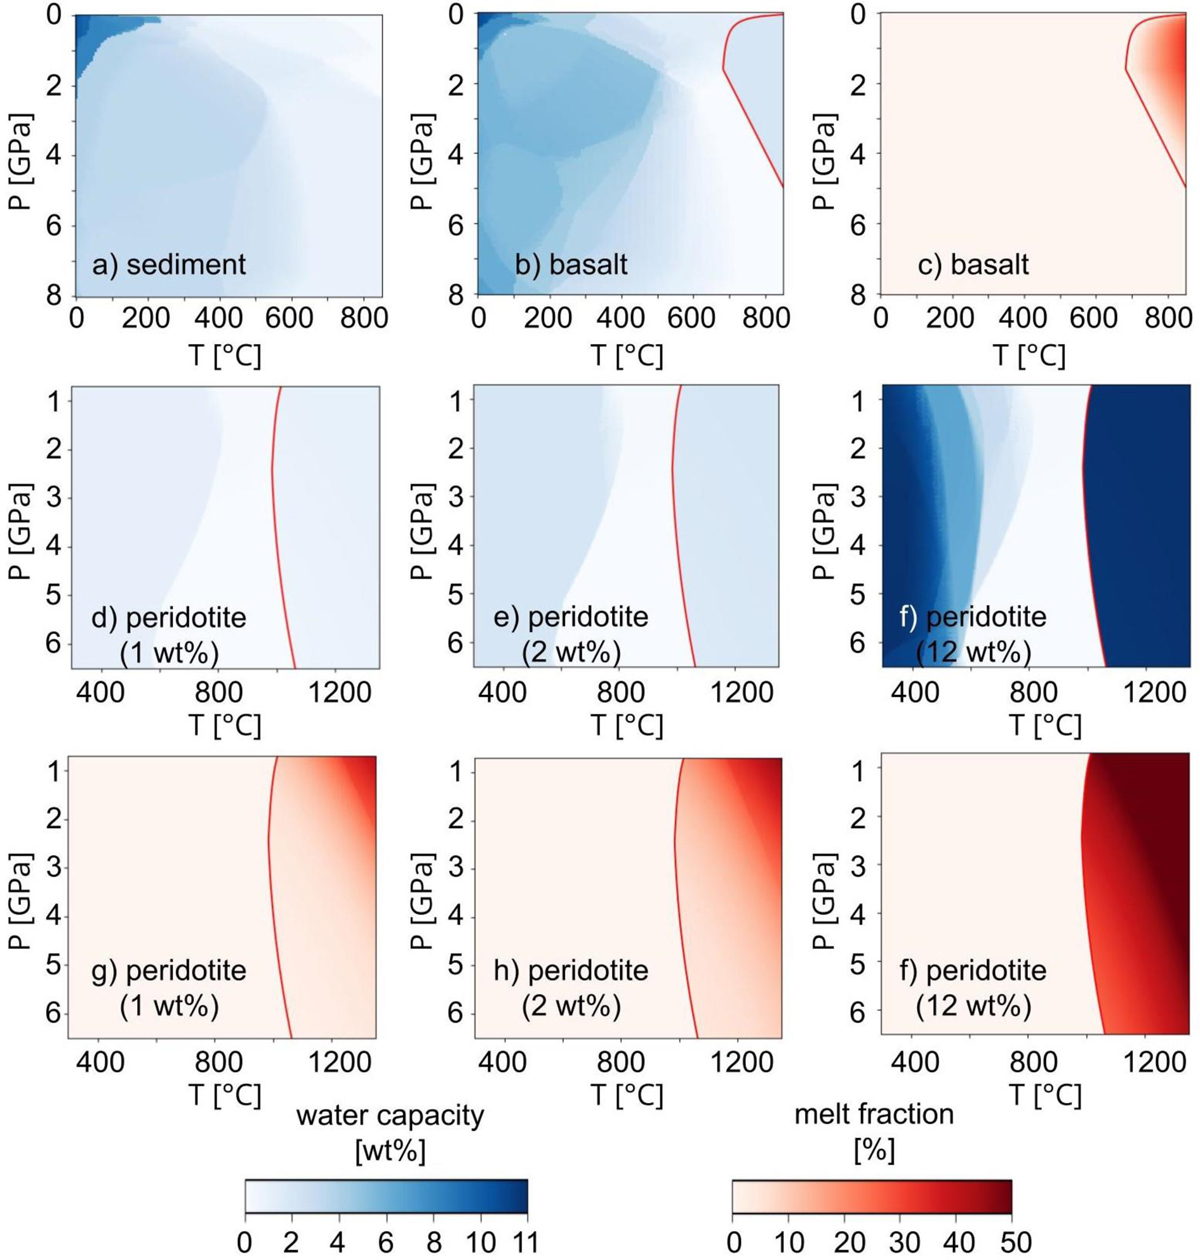
Fig. 3
Download original image
Perple_X tables for water capacity and melt prediction. x-axis represents temperature (°C) and y-axis represents pressure (GPa). Red line represents hydrated solidus. (a) Sediment water capacity; (b) and (c) oceanic crust (basalt compound) water capacity and melt respectively; (d)–(f) mantle (peridotite compound) water capacity with 1 wt%, 2 wt%, and 12 wt% bulk water content respectively; (g)–(i) mantle melt with 1 wt%, 2 wt%, and 12 wt% bulk water content respectively.
Current usage metrics show cumulative count of Article Views (full-text article views including HTML views, PDF and ePub downloads, according to the available data) and Abstracts Views on Vision4Press platform.
Data correspond to usage on the plateform after 2015. The current usage metrics is available 48-96 hours after online publication and is updated daily on week days.
Initial download of the metrics may take a while.