")
")
| Issue |
BSGF - Earth Sci. Bull.
Volume 195, 2024
|
|
|---|---|---|
| Article Number | 25 | |
| Number of page(s) | 19 | |
| DOI | https://doi.org/10.1051/bsgf/2024025 | |
| Published online | 20 December 2024 | |
Magnetic susceptibility controlled by climate-driven weathering intensity
La susceptibilité magnétique contrôlée par l’intensité de l’altération climatique
1
Géosciences Environnement Toulouse, CNRS UMR 5563 (CNRS/UPS/IRD/CNES), Université de Toulouse, Observatoire Midi-Pyrénées, Toulouse, France
2
Géosciences Montpellier, Université de Montpellier, CNRS UMR 5243, Montpellier, France
3
Centre for Planetary Habitability (PHAB), University of Oslo, Oslo, Norway
4
Geology and Sustainable Mining Institute, Mohammed VI Polytechnic University, Ben Guerir 43150, Morocco
5
Department of Earth and Environmental Sciences, Ludwig Maximilians University, Munich, Germany
* e-mail: This email address is being protected from spambots. You need JavaScript enabled to view it.
Received:
14
February
2024
Accepted:
21
October
2024
Abstract
Magnetic susceptibility (MS) variations are commonly attributed to eustatic and/or climatic changes that impact the delivery of fine-grained detrital magnetic minerals. However, the mechanism responsible for sourcing magnetic minerals from land to the ocean is not fully understood. Bulk mineralogy, Rietveld refinements of powder XRD patterns, and whole-rock geochemistry, combined with a MS investigation across a ∼290 m-thick Upper Cretaceous/Paleogene sedimentary sequence at Erguita, Morocco, imply that iron is exclusively detrital in origin. Moreover, MS fluctuations occurred independently from depositional setting and sea-level variations. Rock magnetism investigations further show that a complex assemblage of ferromagnetic sensu lato minerals is recorded in the Erguita sedimentary section, and a proportion of more or less oxidized magnetite supplied to the depositional setting controls the MS variations. This study chronicles that the weathering of the Anti-Atlas crystalline basement led to the supply of detrital Fe-bearing phyllosilicates and ferromagnetic (sensu lato) Fe-oxides to the eastern passive margin of the Atlantic Ocean from the Late Cretaceous to the mid-Paleogene. Higher weathering intensity drove up the detrital magnetic material in all lithologies, which, in turn, increased the MS signal. Importantly, this model nicely coincides with the climatic upheavals of the Paleogene. We propose that this unrecognized link between MS and climate-driven weathering intensity is paramount to unraveling the origin of the low MS interval below the Cretaceous-Paleogene boundary. Climate cooling resulting in reduced weathering rather than a global acidification triggered by Phase 2 of Deccan volcanism could help explain the MS trend at that time.
Résumé
Les variations de la susceptibilité magnétique (SM) sont généralement attribuées à des changements eustatiques et/ou climatiques qui ont un impact sur l’apport des minéraux magnétiques détritiques. Cependant, le mécanisme responsable de l’apport de minéraux magnétiques du continent vers l’océan n’est pas entièrement compris. La minéralogie de roche totale, la méthode de Rietveld à partir de diffractogrammes de poudres et la géochimie de roche totale, combinés à une étude de SM sur une séquence sédimentaire du Crétacé supérieur/Paléogène d’une épaisseur de ∼290 m à Erguita, au Maroc, impliquent que le fer a une origine exclusivement détritique. Les fluctuations de la SM se sont produites indépendamment du cadre environnemental de dépôt et des variations du niveau de la mer. Les études sur le magnétisme des roches montrent qu’un assemblage complexe de minéraux ferromagnétiques sensu lato est enregistré dans la section sédimentaire d’Erguita, et que de la magnétite plus ou moins oxydée contrôle les variations de susceptibilité magnétique Cette étude montre que l’altération probablement du socle cristallin de l’Anti-Atlas a entraîné l’apport de phyllosilicates détritiques contenant du fer et d’oxydes de fer ferromagnétiques (sensu lato) vers la marge passive orientale de l’océan Atlantique, de la fin du Crétacé jusqu’au milieu du Paléogène. L’intensité accrue de l’altération a entraîné une augmentation du matériel magnétique détritique dans toutes les lithologies, ce qui, à son tour, a augmenté le signal de SM. Il est important de noter que ce modèle coïncide parfaitement avec les bouleversements climatiques du Paléogène. Nous proposons que ce lien méconnu entre la SM et l’intensité de l’altération induite par le climat soit primordial pour élucider l’origine de l’intervalle à faibles valeurs de SM sous la limite Crétacé-Paléogène. Un refroidissement climatique entraînant une réduction de l’altération plutôt qu’une acidification globale déclenchée par la phase 2 du volcanisme du Deccan pourrait contribuer à expliquer la tendance à la SM à cette époque.
Key words: Magnetic susceptibility / weathering / climate / Cretaceous / Paleogene / Erguita / Morocco
Mots clés : Susceptibilité magnétique / altération / climat / Crétacé / Paléogène / Erguita / Maroc
J. Aubineau and P.Y.J. Antonio contributed equally.
© J. Aubineau et al., Published by EDP Sciences 2024
 This is an Open Access article distributed under the terms of the Creative Commons Attribution License (https://creativecommons.org/licenses/by/4.0), which permits unrestricted use, distribution, and reproduction in any medium, provided the original work is properly cited.
1 Introduction
The magnetic susceptibility (MS) has been recently invoked as a proxy to identify the Cretaceous-Paleogene (K-Pg) transition (e.g., Abrajevitch et al., 2015; Font et al., 2011; Lowrie et al., 1990). In principle, better constraints on the relationships between MS and climatic and environmental changes could improve our understanding of the external factors controlling the MS record.
MS, which quantifies the capacity of a material to be magnetized in the presence of a magnetic field, first allows assessing the proportion of detrital-dominated ferromagnetic sensu lato (iron oxides), paramagnetic (e.g., Fe-bearing silicates and most of the iron sulfides), and diamagnetic (e.g., iron-free carbonates and quartz) minerals in a given sediment (Ellwood et al., 2000; Riquier et al., 2010). The mineralogical nature of Fe-oxides strongly impacts the MS values (Da Silva et al., 2015). Although paramagnetic and diamagnetic minerals show very low positive or negative MS values, respectively (Ellwood et al., 2000), variations in MS, together with detailed rock magnetic analyses, have been linked to changes in ferromagnetic contribution (Pas et al., 2019; Riquier et al., 2010). Moreover, magnetic minerals with a high coercivity such as hematite yield lower MS signals compared to magnetite, a low coercivity mineral (Da Silva et al., 2013). In sedimentary environments, the primary MS signal is linked to detrital minerals and can be altered by the formation of secondary minerals during diagenesis and metamorphism alteration (Ellwood et al., 2000). Thus, post-depositional processes must be screened for potential modification of the primary MS signature.
MS has been increasingly used to assess the amount of detrital inputs in conjunction with sea level changes, leading to the idea that MS could constitute an independent proxy to document several millions of years of long-term trends of eustatic changes (Da Silva et al., 2015, 2010, 2009; Hladil, 2002; Mahboubi et al., 2019). High MS values were hypothesized to reflect an increasing detrital supply related to sea level fall, particularly in the Frasnian-Famennian transition, where major extinctions coincided with profound eustatic fluctuations (Averbuch et al., 2005; Girard et al., 2021; Riquier et al., 2010). It was supported that MS and sea-level change only covary for a short period of thousands of years (Boulila et al., 2010; Whalen and Day, 2010). Yet, it remains unclear how depositional environments (proximal versus distal) at a given stratigraphic level influenced the MS record.
Several studies have proposed that MS is a correlation tool and generally records paleoclimatic variations (influencing or not eustacy) in sedimentary rocks (Boulila et al., 2010, 2008; Da Silva et al., 2015; Ellwood et al., 2000; Font et al., 2011; Mead et al., 1986; Nowaczyk et al., 2002; Pas et al., 2019; Stage, 2001; Vanderaveroet et al., 1999; Whalen and Day, 2010; Wouters et al., 2019). This inference comes from the relationship between MS trends and oxygen isotopes in Pleistocene sections (Robinson, 1986) and astronomically-driven Milankovitch cycles in Devonian and Jurassic sequences (Boulila et al., 2010; Da Silva et al., 2020, 2015; Ellwood et al., 2015). However, the mechanism that leads to the covariation between climatic variations and MS remains poorly understood.
Here, we explore the MS signal of a ∼290 m-thick Upper Cretaceous/Paleogene phosphorus (P)-bearing sedimentary sequence at Erguita in the Moroccan western High Atlas (WHA), where the sequence stratigraphic framework is well-established (El Bamiki et al., 2020). We use a combination of mineralogical, rock magnetism, and geochemical techniques to demonstrate the detrital origin of MS signal across the section. Then, we provide evidence linking MS variations to climate-driven weathering intensity. The findings also offer new insights on using MS records in deep geological time.
2 Geological background
2.1 General information
The ENE-trending High Atlas Mountain belt in Morocco belongs to the Atlas system that spreads over thousands of kilometers from the Atlantic coast to Tunisia. The tectonic convergence between the African and Eurasian plates since the Late Cretaceous has promoted the inversion of the Mesozoic-Cenozoic intracontinental basin (Atlasic basin) during which former syn-rift faults were reactivated (Frizon de Lamotte et al., 2008; Michard et al., 2008).
The Triassic Central Atlantic rifting initiated the formation of the Atlasic basin in Morocco, which resulted in important thermal subsidence and subsequent deposition of km-thick Mesozoic marine sequences near the rifted zones (Ellouz et al., 2003). This is in contrast to the thin Upper Cretaceous-Paleogene sedimentary successions that were formed when thermally-induced subsidence stopped at the initiation of the Africa-Eurasia convergence (Ellouz et al., 2003). In Morocco, a tremendous amount of phosphate-rich sediments accumulated on shallow water platforms under the strong influence of Atlantic upwelling currents from the Late Cretaceous to the Eocene (Pufahl and Groat, 2017). They are now preserved within vast plateaus (e.g., Gantour, Ouled Abdoun, and Meskala basins) and along the margins of the western High Atlas (Fig. 1a). The P-rich sediments were bordered by the deformed Variscan basement to the north and east, and by the Paleozoic fold belt of the Anti-Atlas to the south (Herbig and Trappe, 1994). The latter constituted the adjacent hinterland area (El Bamiki et al., 2020). Then, the WHA recorded multiple phases of shortening and uplift with a major event during the Neogene (Frizon de Lamotte et al., 2008, 2009; Lanari et al., 2020; Leprêtre et al., 2018; Missenard et al., 2008). The erosion of the uprising WHA is delivering substantial continental materials to foreland basins (i.e., Haouz, Ouarzazate, and Souss basins), which formed along the northern and southern margins of the orogen (Michard et al., 2008).
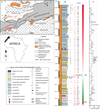 |
Fig. 1 (a) Simplified structural map of the western High Atlas in Morocco, modified from El Bamiki et al. (2020). (b) Detailed lithostratigraphic column of the Erguita section with interpreted regressive and transgressive trends. (c) Gamma-ray curve showing the U content within the sediments. It is assumed that U reflects the proportion of phosphate minerals because of their great incorporation of trace elements, including U, compared to carbonates, sandstones, and marls (Aubineau et al., 2022a; Nathan, 1984). |
2.2 Erguita section
The Erguita section described by Ambroggi in the sixties corresponds to the distal facies of the WHA sedimentary sequences (Ambroggi, 1963). In contrast, shallow proximal facies are found to the east in the Ouarzazate basin (Fig. 1a; El Bamiki et al., 2020). The phosphate-bearing series, first deposited during the Maastrichtian, unconformably overlies Campanian carbonates (Ambroggi, 1963). Based on sedimentological features, sequence stratigraphy, and biostratigraphic data of nannoflora, second-order transgressive-regressive cycles have been successfully described in the WHA between the Late Cretaceous and Eocene (El Bamiki et al., 2020). The Maastrichtian Erguita rocks, consisting of marls and P-poor carbonates accumulated during an episode of sea level rise and fall, are capped by thin gypsum layers (Figs. 1b, 1c, 2a; El Bamiki et al., 2020). The large regression of the late Maastrichtian, leading to the widespread karstification in the eastern part of the WHA has been inferred as the potential event that facilitates gypsum precipitation in proximal environments at Erguita. The overlying Danian-Selandian rocks are mainly characterized by P-rich calcarenites, marls, and thin P-poor carbonated sandstones passing upwards through massive P-rich carbonated sandstones (Figs. 1b, 1c, 2b; El Bamiki et al., 2020). In these sediments, hummocky cross-stratification, interpreted to form within the outer platform between the storm wave-base and the fair-weather wave-base (Burchette and Wright, 1992), and overlying gravity-flow deposits, accumulated below the storm wave-base, indicate a basin deepening (Figs. 1b, 2c, 1d; El Bamiki et al., 2020). Deposition of organic-rich marls in the Erguita section has recorded the maximum flooding interval, a stratigraphic marker interval in the WHA (Fig. 1b; El Bamiki et al., 2020). Then, the basal Thanetian sediments are dominated by turbiditic phosphates, where the phosphatic particles have been transported basinward and rapidly accumulated with a normal grading pattern (Figs. 1b, 1c; El Bamiki et al., 2020). The greater distance of the Erguita depositional setting from the phosphogenic window and larger detrital inputs diluting phosphate concentrations have led to lower phosphorus enrichment in sediments compared to the Gantour basin, among others (Aubineau et al., 2024a; El Bamiki et al., 2020, 2021, 2023). The progressive deposition of P-containing calcarenites and carbonates, clayey calcarenites, shell beds, and marls, together with the upward increase in faunal content (nautiloids, Thalassinoides burrows network, gastropods, bivalves, oysters), characterize the upper part of the section (Figs. 1b, 1c, 2e-2i; El Bamiki et al., 2020). This pattern reflects the regressive phase of the basin, where macroorganisms were likely diversified during the Eocene. During the studied interval, detrital materials and soluble elements probably originated from the emerged Anti-Atlas rocks (El Bamiki et al., 2020; Herbig and Trappe, 1994). Finally, this section is truncated and unconformably covered by Neogene conglomeratic sediments resulting from the erosion of the uprising High Atlas (Ambroggi, 1963; El Bamiki et al., 2020).
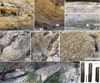 |
Fig. 2 Facies and sedimentological features. (a) Gypsum layers (arrows) in the basal Erguita section. (b) Massive P-rich carbonated sandstones. Note that these rocks are sometimes crumbly. (c) Hummocky cross-stratification. (d) Finning-upward gravity-flow deposit. (e) Nautiloid. (f) Turritella and Oenopota gastropods. (g) Massive shell bed composed of oyster fragments. (h) Alternating carbonates and clayey calcarenites in the uppermost part of the section. (i) Example of oriented cylindrical cores consisting of P-rich calcarenite. Arrows show mm-sized, unsorted phosphatic grains. Scale bar: 5 cm. Sample number is indicated in the white rectangle. Coin diameters: 2.4 cm in (d, f) and 2.7 cm in (e). Hammer and pen lengths: 33 and 15 cm, respectively. |
3 Material and methods
3.1 Sampling and sample preparation
We sampled 279 oriented cylindrical cores with a portable gasoline-powered rock drill, three oriented blocks with hand sampling techniques (Tauxe et al., 1998), and additional unoriented rocks from the Erguita section in Morocco. All samples from freshly exposed outcrops are in the vicinity of the Erguita riverbed. The coordinates are presented in Table S1. A hundred of stratigraphic levels were studied within the ∼290 m thick sedimentary section to characterize the magnetic susceptibility (Fig. 1b). The sampling interval ranges from 0.5 to 6.8 m.
In each of the drilled horizon, three oriented cylindrical cores were collected. The drilling of oriented blocks was carried out at Geosciences Montpellier, University of Montpellier, France. For clarity, sample “1” refers to cylindrical cores number 1, 2, and 3, while “OB” refers to the oriented blocks. We designated unoriented rocks with a letter behind the sample number. For example, sample 109a is therefore located between oriented samples 109 and 112.
We constructed the lithostratigraphic column after carefully examining outcrops, cylindrical cores, the gamma-ray curve, and XRD and geochemical data (Figs. 1b, 1c). We logged all samples to provide information on their stratigraphic position. Standard specimens (2.2 cm in height and 2.5 cm in diameter) from the oriented cylindrical cores and oriented blocks (1–5 per core) were prepared at Geosciences Montpellier, leading to the production of more than 800 specimens. From those cylindrical specimens, 627 were selected (specimens that did not fit into the 3D rotator sample holder were not analyzed) and measured to study the magnetic susceptibility. We crushed and milled by hand in agate mortar representative samples for mineralogical and whole-rock geochemical examination.
3.2 X-ray diffraction
X-ray diffraction (XRD) mineral analyses were performed on powdered bulk samples using a Bruker D8 ADVANCE diffractometer (CuKα radiation) operating at 40 kV and 40 mA to identify the mineralogical phases of P-containing rocks at RRXG platform, University of Montpellier. Analysis of bulk powders was performed over an angular range of 4–62° 2θ and a step size of 0.02° 2θ per 2 s. Bruker Eva software was used for indexing peaks, and XRD patterns were compared with reference data (Brindley and Brown, 1980).
Moreover, Rietveld refinement of XRD patterns allowed a semi-quantification of bulk mineralogy (Tab. 1) using the Profex 4.3.1 interface with the program BGMN (Döebelin and Kleeberg, 2015). Regardless of the software programs used, quantification is challenging when dealing with clay minerals (Hillier, 2000). The accuracy of clay mineral quantification is generally lower than 5 wt.% and up to 10 wt.% when amorphous phases are present (Warr, 2022).
Semi-quantification of the mineralogical assemblages in the Erguita sediments. Data were obtained after careful examination of bulk XRD patterns.
3.3 Whole-rock geochemistry and weathering intensity
We performed whole-rock geochemical analyses of major and trace elements on 10 samples of various lithologies (Tab. 2). Powdered samples were fused with lithium metaborate (LiBO2) for trace and major element measurements (Carignan et al., 2001). Major elements were measured by inductively coupled plasma (ICP) optical emission spectrometry, and trace elements by ICP mass spectrometry at Service d’Analyse des Roches et Minéraux, Nancy, France. Measurement uncertainty and instrument detection limit relative to international standards and sample replicates (Carignan et al., 2001) are provided in Table S2. Reference standards include Basalt BR, anorthosite AN-G, diorite DR-N, serpentinite UB-N, and granite GH (Carignan et al., 2001).
The quantification of the degree of chemical weathering of source rocks was determined by means of the chemical index of alteration (CIA), where CIA = [Al2O3/(Al2O3+CaO*+Na2O+K2O) × 100] in mole fraction (Nesbitt and Young, 1982). CaO* is the amount in the silicate fraction. Considering the varying proportions of carbonates and phosphates in the Erguita sedimentary rocks (see Sect. 4.2), CaO* of our samples is assumed with CaO* = CaO when the mole fraction of CaO is ≤ Na2O and CaO* = Na2O when the mole fraction of CaO is ≥ Na2O, as previously reported (Jian et al., 2013). Typically, unweathered, moderately weathered, and highly weathered rocks have low (<60), 60–80, and high (>80) CIA values, respectively (Fedo et al., 1995). The pristine phosphatic lithofacies usually show low P2O5 contents, while substantial P enrichment within sediments derives from syndepositional repetitive wave and storm winnowing by removing the fine-grained sedimentary detritus (Pufahl and Groat, 2017). As a result, the formation of winnowed phosphates (i.e., phosphate-rich rocks) hinders the calculation of CIA due to potential removal of the silicate fraction (Tab. 2).
Major and trace element compositions and CIA values of representative Erguita sediments.
3.4 In situ gamma-ray spectrometry
Uranium concentrations, used as a proxy for sedimentary phosphate minerals, were measured in situ with a portable gamma-ray spectrometer: the Gamma Surveyor Vario (GF Instruments), equipped with a Bismuth Germanium Oxide (BGO; Bi4Ge3O12) scintillator with 2048 channels, along with a 19 cm3 detector with probe dimensions of 45 mm and a length of 301 mm (VB1). This equipment allows the measurement of energies up to 3 MeV. In all studied stratigraphic levels, measurements were acquired by direct probe contact with rock outcrops at planar spots (Table S3). The measurement time was 180 seconds, as recommended by the manufacturer to optimize time and precision.
3.5 Magnetic measurements
Magnetic susceptibility measurements were performed on 627 specimens using an AGICO KLY-5 Kappabridge with an alternative field of 400 A m−1 peak value (frequency: 1220 Hz) at the Géosciences Environnement Toulouse laboratory (France). We normalized the MS values with respect to the theoretical volume of specimens (10 cm3). Anisotropy data were processed with the ANISOFT software v.6.1.01 (Chadima and Jelínek, 2008). The ellipsoid of magnetic susceptibility is defined by the orientation and length of the three principal susceptibility axes with K1 > K2 > K3 (Jelinek, 1981). Km represents the mean volume-specific magnetic susceptibility (SI) and reflects the volume content of magnetic minerals in the specimen. The degree of anisotropy (P = K1/K3) represents the intensity of the preferred orientation of magnetic minerals. The T parameter represents the shape of the ellipsoid and varies from −1 (perfectly prolate) to +1 (perfectly oblate). The magnetic lineation (L = K1/K2) is defined by the maximum axis of the ellipsoid, and the magnetic foliation (F = K2/K3) is the plane containing K1 and K2.
3.6 Rock magnetism investigations
Carbonates and carbonated sandstones from the Erguita section carry natural remanent magnetizations with values ranging from 1.8 × 10⁻¹⁰ to 1.9 × 10−09 Am2 (measurements from 79 oriented core specimens using the Sushibar at LMU Munich). Such rocks with both weak magnetization and weak magnetic susceptibility values (see Results) are challenging to accurately characterize the magnetic mineralogy by means of standard techniques. To tentatively define the magnetic mineralogy, we measured the magnetic hysteresis of six selected samples at room temperature and the low-temperature remanence with a sensitive Quantum Design Magnetic Properties Measurement System (MPMS 3) at the Institute Charles Gerhardt Montpellier (France). The samples were selected along the section to represent stratigraphic levels with strong, intermediate, and weak magnetic susceptibility values. We used the SQUID-VSM configuration of the MPMS3 to achieve a sensitivity, which is lower than 1 × 10⁻¹¹ Am2. The bulk fragments were mounted on a clean quartz paddle holder with varnish (sample mass < 50 mg and maximum magnetic moments of the quartz rode measured at room temperature with 2.5 T: 5.6 × 10⁻¹⁰ Am2). Hysteresis curves were measured at room temperature between −1 and 1 Tesla and processed with HystLab (Paterson et al., 2018). We performed the following low temperature characterization protocol (FC-ZFC-RTSIRMcool-RTSIRMwarm) for the 6 samples (Bilardello and Jackson, 2013): (i) we applied a 2.5 T field during the cooling of the sample followed by the measurement of the remanence until 300 K in zero field (FC, Field-Cooled curve); (ii) next the sample is Zero-Field Cooled and the remanence is measured after applying a short 2.5 T field at low temperatures (ZFC curve); (iii) then, we applied a 2.5 T field at room temperature and we measured the remanence (Room Temperature Saturation Isothermal Remanent Magnetization, RT-SIRM) during the cooling (RT-SIRMcool) and warming to 300 K (RT-SIRMwarm).
4 Results
4.1 Rock magnetism results
At first glance and considering the complexity of measuring rock magnetic data of these rocks, three groups of magnetic mineralogy were determined (see Fig. S2 for the extensive dataset). The first group (including samples 28, 109, and 166 among the six selected samples) is characterized by samples with a sharp Verwey Transition (Tv) observed at ∼120 K (Kosterov, 2002; Özdemir et al., 2002; Verwey, 1935) in both ZFC and RT-SIRM curves, indicating the presence of magnetite as the dominant carrier of the remanent magnetization (Fig. 3a). Moreover, the ZFC curve is above the FC curve, which could suggest a dominance of monodomain grains even if we cannot exclude the presence of pseudo-single domain grains. Indeed, the Mrs/Ms ratios (ratio of remanent saturation moment Mrs to saturation moment Ms) derived from room temperature hysteresis curves show values between 0.08 and 0.12, suggesting a possible pseudo-single domain state rather than single-domain state (Dunlop and Özdemir, 1997). We observe a hump-shaped in the cooling curves between 300 K and the Verwey transition associated to a symmetric hump in the warming curve, which could be associated to the maghemitization, i.e., the partial oxidation of the magnetite particles (Özdemir and Dunlop, 2010). Finally, convergence of FC and ZFC curves around 300 K (Fig. S2) could suggest the presence of goethite in these samples (Taylor et al., 2014). The second group (samples 1 and 103) reveals a faint Tv in the ZFC curve due to magnetite with a downward curvature for the RT-SIRM curves (Fig. 3b). For the sample 103, the magnetic grains seem to be in a superparamagnetic state with no observed coercivity associated to a large remanence drop below 50 K (FC curve). Such smooth and broadened Tv can also be associated to the presence of maghemite. This is consistent with the hypothesis that the finest particles are the most affected by the maghemitization (Özdemir and Dunlop, 2010). Presence of goethite is also suggested by the FC-ZFC convergence after 250 K. The third group (only sample 250) is dominated by the presence of goethite with a characteristic behavior of the reversible RT-SIRM, ZFC, and FC curves (Fig. 3c; Dekkers, 1989). A faint Tv is observed in this sample when looking at the ZFC derivative curve (Fig. S2). The nearly strait with a slight opened loop of the hysteresis curve supports the occurrence of magnetite together with a mixture in the magnetic assemblage (Fig. 3c). It is worth noting that the presence of other iron oxide minerals (e.g., hematite) or pyrrhotite cannot be ruled out with the available data. For example, a small peak at ∼250 K for RT-SIRM cool for samples 28 and 166 is observed, but the Morin transition, indicating the presence of hematite (Morin, 1950; Özdemir and Dunlop, 2005), is not supported on the ZFC/FC curves (Fig. S2). Collectively, these rock magnetic data demonstrate the presence of dominant paramagnetic phase as suggested by a steep positive slope of the hysteresis loops associated with a complex ferromagnetic sensu lato assemblage with fine magnetite that can be altered in maghemite, and goethite. Presence of pyrrhotite or hematite is not excluded.
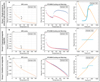 |
Fig. 3 Rock-magnetism data of the Erguita sediments. (a) Group 1 corresponding to single-domain to pseudo-single-domain magnetite. (b) Group 2 corresponding to superparamagnetic magnetite. (c) Group 3 corresponding to a mixture of iron oxides and iron oxyhydroxide minerals. Left panel, ZFC (zero field cooled) curve with the apparent Verwey transition (Tv); middle panel, mass-normalized RT-SIRM cycles, warming (in red) and cooling (in blue); right panel, uncorrected (orange) and corrected (blue) hysteresis loops. |
4.2 Magnetic susceptibility data and weathering intensity
Depending on the lithology and the number of specimens (3 to 13 per horizon), 2 to 10 measures from different specimens were performed and averaged for each stratigraphic level (Table S4). The P-containing samples studied along the stratigraphic interval of the Erguita section have a mean MS range of −6.2 × 10⁻⁶ to 6. × 8.10−5 SI (Fig. 4a). Moving upsection, the MS values first show a general increase of 3.1 × 10⁻⁵ SI between samples 1 and 28. This is then followed by a progressive upward decrease from the samples 28 to 184, with mean MS values spanning 5.5 × 10⁻⁵ to −3.3 × 10⁻⁶ SI, before increasing and decreasing again to 2.6 × 10⁻⁵ SI (sample 250) and −3.1 × 10⁻⁶ (sample 277), respectively. Also, multiple short-term MS fluctuations are observed within these intervals. Finally, the MS values switch to a dramatic ascending increase in sample OB3 with 6.8 × 10⁻⁵ SI. Importantly, the MS trends do not vary in response to lithological or long-term eustatic changes. On the other hand, a notable positive relationship is observed between MS and CIA values, as evidenced by an R2 value of 0.6 and a p-value of 0.02 (Fig. 4b). The average CIA value in the studied section is 68 ± 7, suggesting a moderate level of weathering in the source rocks (Fedo et al., 1995; Nesbitt and Young, 1982).
 |
Fig. 4 (a) Magnetic susceptibility curve (SI) with interpreted transgressive-regressive trends in the Upper Cretaceous/Paleogene succession at Erguita. The red line corresponds to the mean MS values, while the black line is the mean MS values with one standard deviation. Legend of the lithostratigraphic column is on Figure 1. The stratigraphy is based on El Bamiki et al. (2020). (b) Scatter plot between the chemical index of alteration and magnetic susceptibility. P-rich sediments are not shown because their formation falsifies the CIA values. |
4.3 Relationships between MS and mineralogical and geochemical contents
Before evaluating the influence of detrital input on MS, we constrained and semi-quantified the mineralogical phases of 27 samples of various lithologies (Fig. S1, Tab. 1). Bulk XRD mineralogical data show that the Erguita sediments mainly comprise two dolomitic minerals and quartz with varying proportions of calcite, carbonate fluorapatite (CFA), and clay minerals. K-feldspar, gypsum, and pyrite appear in small abundances. Typical clay minerals like chlorite, illite/mica, smectite, and kaolinite are observed. In addition, palygorskite, which is a Si- and Mg-rich phyllosilicate (Brindley and Brown, 1980), was mainly detected in the lowermost and uppermost parts of the section (Fig. S1), where the sedimentary succession displays very shallow-water environments. The clay mineralogical assemblage at Erguita is closely similar to the Gantour and WHA lithologies (Aubineau et al., 2022a, 2022b). In general, the XRD mineralogical analysis reveals that siliciclastic detrital material is widespread throughout all lithologies, except two pure carbonate samples.
There is no significant correlation between the proportions of carbonates, quartz, and CFA and the evolution of MS (R2 = 0.02, p = 0.57 for carbonates, R2 = 0.01, p = 0.72 for quartz, and R2 = 0.2, p = 0.04 for CFA). However, the scatter plot between the amount of clay minerals and MS reveals a strong covariation (R2 = 0.72, p = 0.22) (Fig. 5). This is coherent with the strong covariation between Al − a detrital indicator − and MS (R2 = 0.76, p = 0.001) (Fig. 6a). In addition, the Fe versus MS plot indicates that the origin of the MS signal is well supported by Fe-bearing minerals (R2 = 0.87, p = 7 × 10⁻⁵) (Fig. 6b). The near-perfect covariation between Al and Fe (R2 = 0.95, p = 2 × 10⁻⁶) points to a detrital origin of Fe-bearing minerals (Fig. 6c). Although zircons are presumably detrital grains, the lack of correlation between Zr and MS (R2 = 0, p = 0.90) suggests that zircons and magnetic grains were not tightly bound during transportation and deposition of the Erguita sediments (Fig. 6d), which is best explained by their difference in grain size and density.
The PAAS-normalized Rare Earth Element and Yttrium (REEYSN, where SN represents values normalized to PAAS) patterns of the Erguita sediments are relatively similar to each other (Fig. 7a), suggesting uptake of REEY from a geochemically uniform fluid. The REEYSN patterns show light (L)REE depletions relative to heavy (H)REE with (La/Yb)SN values ranging from 0.49 and 0.88 (Fig. 7a; Tab. 2). The latter observation is consistent with the (Sm/Yb)SN and (Sm/Pr)SN ratios plotting on the HREE enriched field (Fig. 7b), excluding middle (M)REE enrichment. Moreover, the (Ce/Ce*)SN versus (Pr/Pr*)SN diagram reveals a true negative Ce anomalies in the Erguita sediments (Fig. 7c). Combined, these characteristics yield features akin to those of modern seawater (Alibo and Nozaki, 1999; Bau et al., 1997; Bau and Dulski, 1996; De Baar et al., 1985; Garnit et al., 2012). Besides, the sediments have Y/Ho ratios between 26 and 46, reflecting terrestrial and marine mixing inputs, where Y/Ho ratios >40 and ∼26 represent a seawater signal and a strong terrestrial input dominated by fine-grained materials, respectively (Bau et al., 1997). This is further supported by the strong covariation between Y/Ho and Zr in the carbonated sandstones (R2 = 0.72) (Fig. 7d).
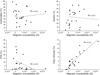 |
Fig. 5 Relationship between the proportion of most abundant mineral phases and magnetic susceptibility in the Erguita sediments. Linear regressions are shown without the incorporation of negative MS values. |
 |
Fig. 6 Scatter plots showing the relationships between Al and MS (a), Fe and MS (b), Al and Fe (c), and Zr and MS (d). |
 |
Fig. 7 REEY geochemistry of the Erguita section. (a) Average PAAS-normalized REEY patterns compared to modern seawater (Alibo and Nozaki, 1999). Light (L)REE (La to Nd), Middle (M)REE (Sm to Dy), and Heavy (H)REE (Ho to Lu). Geochemical data of PAAS are from Taylor and McLennan (1985). (b) Sm/Yb)SN vs. (Sm/Pr)SN, after Garnit et al. (2012). Data of SW are from Alibo and Nozaki (1999). (c) Ce anomaly vs. Pr anomaly, after Bau and Dulski (1996). (d) Cross plot between Y/Ho and Zr showing the source of REE within the depositional environments. The Y/Ho ratios indicate a mixing source of REE. |
5 Discussion
5.1 Diagenetic considerations
Post-depositional processes during diagenesis can alter the primary MS signature. For example, Schneider et al. (2004) suggested a genetic link between MS values and Fe-rich carbonates formed during the migration of diagenetic fluids. Although the Erguita limestones are dolomitized, numerous lines of mineralogical and geochemical evidence point to an absence of late’/extensive diagenetic processes that could have erased the detrital MS signal.
Sediments fed by hydrothermal fluids are usually enriched in Fe (e.g., Chavagnac et al., 2018; Clarkson et al., 2014), leading to an absence of covariation between Al and Fe. No such decoupling was observed in the Erguita sediments. Instead, the strong correlations between Al, Fe, and MS reflect the detrital prevalence of magnetic minerals. Bulk XRD patterns do not show illite/smectite mixed-layer minerals. The absence of such minerals in other WHA sections (Aubineau et al., 2022a; Knidiri et al., 2014) indicates minimal diagenetic transformations within the sediment pile (Środoń and Eberl, 1984; Velde et al., 1986). Besides, elevated CFA-hosted CO32–concentrations characterize the P-containing Erguita samples, where they averaged 5.9 ± 1.6 (1σ, n = 13) (Tab. S5, method of calculation presented in Schuffert et al. (1990), comparable to the 4–8 wt.% CO32–content of Moroccan CFA grains (Aubineau et al., 2024b, 2022b, 2022a; Cosmidis et al., 2013; El Bamiki et al., 2023; Kocsis et al., 2014; Nguidi et al., 2021). This trend results from the equilibrium of CFA with seawater (Nathan, 1984), while thermal diagenesis and weathering result in progressive decarbonation of CFA toward fluorapatite composition (i.e., nearly zero CO32–substitution) (McClellan and Van Kauwenbergh, 1991).
Furthermore, the REEY distribution in sedimentary rocks allows the evaluation of seawater chemistry in depositional settings. REEY typically exhibit a conservative behavior (i.e., no fractionation) during sediment deposition (e.g., Bau and Dulski, 1996; Shields and Stille, 2001). The REEY pattern and composition in the Erguita sediments agree with deposition in fully oxygenated seawater (Alibo and Nozaki, 1999; Bau et al., 1997; Bau and Dulski, 1996; De Baar et al., 1985). MREE enrichment with respect to LREE and HREE (Reynard et al., 1999), caused by anoxic porewaters or late diagenetic fluids as a source of REEY is not observed in our samples. The (La/Yb)SN ratios ranging from 0.5 to 0.9 in the Erguita sediments compared to 0.4–0.5 for modern seawater suggest adsorption mechanisms (Reynard et al., 1999). The negative correlation between Zr and Y/Ho, together with Y/Ho ratios being more similar to clastic sediment values, hint that REEY values are also influenced by siliciclastic detritus derived from continental weathering. Therefore, we interpret the REEY distribution at Erguita to mirror the chemical composition of seawater, from which terrestrial REEY fluxes via continental runoff were sourced to the depositional environments. Also, the REEY probably adsorbed onto the siliciclastic detritus.
In light of the above considerations, the MS signal in this study is primarily attributed to detrital sources. Thus, the Erguita MS data can be reliably used for paleoenvironmental and/or paleoclimatic reconstructions.
5.2 Origin of the magnetic susceptibility variations
The rock magnetism of representative Erguita rocks has revealed that there is no correlation between the magnetic mineralogy and variations in magnetic susceptibility since the magnetite-bearing samples of the first group show both high and low MS values. The MS signal at Erguita does not correspond to the lithological changes, but instead shows a consistent relationship with the amount of clay mineral present in the entire section. The MS changes could be attributed to variations of paramagnetic mineral proportions, such as Fe-bearing phyllosilicates. However, the dominant presence of Fe-free palygorskite [Si8O20(Mg2Al2)(OH)2(OH2)4 · 4H2O] (Singer and Galan, 1984) associated with the highest MS value in the upper part of the section does not fully support the relationship between MS and paramagnetic mineral content. Collectively, the data suggest that the proportion of more or less oxidized magnetite supplied to the depositional setting controls the MS variations at Erguita.
The covariation between MS and clay mineral content likely indicates that ferromagnetic sensu lato minerals and phyllosilicates were supplied together to the depositional setting. The Erguita samples show a magnetic fabric typical of sedimentary rocks (type 1 according to Aubourg et al., 2004), which is revealed by the high inclination of K3 axes and the random distribution of K1 and K2 axes within the horizontal plane (Fig. 8a). Figure 8 shows that the magnetic foliation of the mean average of all sites from the Erguita section is oblique to the bedding plane by ∼24°, whereas the K1 axis is perpendicular to the K3 direction. At first order, there is an overall consistency across the ∼290 m-thick section. Such AMS fabric suggest that the particles are rolled and transported from the SE to the NW if we assume the K3 axis as an indicator of paleocurrent direction. A site-by-site analysis shows a tendency with a predominance of oblate-type ellipsoid when the fabric is very well defined. The main AMS fabric may reflect the behavior of the different paramagnetic phases in the samples, as suggested by the rock magnetic data (Fig. S2). Moreover, for the specimens dominated by a ferromagnetic sensu lato assemblage (e.g., sample 166), the corresponding AMS may reflect the behavior of oxidized magnetite associated to goethite particles. The samples were further divided into two subpopulations, representing the phyllosilicate proportion (Fig. S3). The Al-rich samples (i.e., high proportion of clay minerals) show a more oblate fabric parallel to the bedding plane in agreement with the platy morphologies of the phyllosilicates compared to the Al-poor samples (i.e., low proportion of clay minerals). The K3 axis for the Al-rich samples are plunging to the N with a slight imbrication. After removing the specimen with high-anisotropy value (ERA31A), the fabric of the Al-poor samples is better defined with a fabric close to the Al-rich subpopulation with an imbrication to the NW. Despite a wide dispersion, the K1 is relatively aligned to the K3 direction. Given the lack of sedimentary evidence to provide a paleocurrent orientation, the dominant direction of the K3 axes to the NW could be used as a first indicator.
We hypothesize the emerged Anti-Atlas crystalline basement to the SE as a source of detrital materials to the Erguita depositional environment, as already suggested by El Bamiki et al. (2020) and Herbig and Trappe (1994). Thus, one process occurring on the Anti-Atlas Mountains should exclusively explain the simultaneous delivery of clay and ferromagnetic minerals to the depositional sites. Some sites (52, 100, 229, 247, 250) show an inverse fabric with horizontal K3 in Figure 8. The hypotheses to explain the origin of such inverse AMS fabric include the occurrence of (i) single-domain magnetite (Potter and Stephenson, 1988), (ii) high susceptibility minerals as maghemite (Borradaile and Puumala, 1989), (iii) greigite and some suitable titanomagnetite compositions (Aubourg and Robion, 2002).
Autocyclic physical processes, including tidal current and wave and storm winnowing, are superimposed on tectono-eustatic-climatic allocyclic forcing (Walker and James, 1992). Inherent to the depositional system, the former processes over short-time and temporal scales may reduce the visibility of the expected long-term allocyclic variations. With this in mind, hydrodynamic winnowing, reworking, and transporting that have led to the in situ phosphate enrichment in the Erguita sediments (El Bamiki et al., 2020) may have been an important controlling factor. These hydrodynamic processes could have thus removed the ferromagnetic and paramagnetic fractions, increasing and decreasing the CFA content and MS values, respectively. In the Moroccan phosphate-bearing rocks, uranium is mainly hosted by CFA (Aubineau et al., 2022a). In addition to U, P2O5 concentration is a tracer for CFA enrichment. Combined, these proxies allow to decipher whether the autocyclic processes led to the observed MS variations in the Erguita section. The relationships between CFA abundance, U and P2O5 concentrations, and associated MS are weak, as shown in Figure 5 and Figure S4. This strongly supports that mechanical winnowing/reworking, resulting in the phosphate enrichment in sedimentary environments, along the Atlantic Paleogene passive margin did not intensively contribute to the expression of MS values.
Weathering drives the delivery of siliciclastic material from the land to oceans (Walker et al., 1981). Global tectonic, sea-level, and climate changes strongly influence weathering regimes. Thus, such events should exert considerable pressure on the flux of magnetic minerals. Considering the relative tectonic stability in northwestern Morocco between the late Cretaceous and Paleogene (Charton et al., 2021), the onset of the Africa-Eurasia convergence did not influence the MS values. The amount of detrital particles transported from land to oceans could have increased during times of regression (Crick et al., 1997; Ellwood et al., 1999). In this scenario, sea level fall leads to a lowering of the base level, which in turn increases erosion. However, our results show a long-term decreasing MS trend in both sea level rise and fall, hinting that eustatic fluctuations over millions of years did not influence the MS trend in the Erguita section.
In contrast, MS values correlate well with CIA − a proxy of weathering intensity, suggesting a direct connection between climate change and MS. Nonetheless, the CIA values of sedimentary rocks may be prone to unavoidable limitations (Fedo and Babechuk, 2022; Meunier et al., 2013). Besides, the omission of SiO2 content in the CIA calculation, the composition of the source rock and the effect of K addition during diagenesis can potentially influence the CIA index. Typically, mafic igneous rocks rich in ferromagnesian content can generate misleading interpretations (Fedo and Babechuk, 2022). In other words, the CIA index must be used to the study of feldspar-hosted rocks of the upper continental crust and derived sediments. The Erguita sedimentary rocks fulfill this criterion as we observe a felsic provenance with related minerals like K-feldspar and quartz (Fig. S1). Our observations indicate that the CIA values are reliable.
The upper Erguita sequence of Eocene age (El Bamiki et al., 2020) shows the highest CIA and MS values. The climate state in the Paleogene was highly dynamic with long-term warming (e.g., early Danian) and cooling (e.g., mid-Danian to early Thanetian) periods (Westerhold et al., 2020). In addition, a 9-million-years unprecedented hothouse state occurred during the early Eocene − also known as the Early Eocene Climatic Optimum (EECO), when temperatures were >10 °C warmer than today. As a corollary, the rise of atmospheric CO2 concentrations increases temperature and precipitation, thereby enhancing chemical weathering (Walker et al., 1981; Warr, 2022). In the upper Erguita section, we propose that the EEOC possibly drove up the supply of detrital magnetic components to the shallow waters. Also, our model should imply any relationship between low CIA, MS values, and colder temperatures. This pattern seems to be preserved during the maximum flooding interval at the Selandian-Thanetian transition (Fig. 4) when temperatures were the coolest of the Paleocene (Westerhold et al., 2020). Considering this, our data indicate that the intensity of weathering induced by climate has a significant impact on the long-term evolution of MS. (Fig. 8c). Our work does not rule out the possibility of minor controls exerted by sea level changes on MS trend during high-frequency perturbations, as proposed by Whalen and Day (2010).
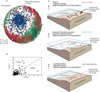 |
Fig. 8 (a) Data plotted on a lower hemisphere stereonet projection showing the magnetic grain fabric. This projection derives from the AMS ellipsoid (for a comprehensive illustration see Zhang et al. (2010) and Bilardello (2021). Kmin is vertical and Kmax and Kint axes are randomly distributed within the horizontal plane, which indicates deposition of particles under gravity only. (b) Flinn diagram (Flinn, 1978) of AMS data showing a minimum degree of anisotropy due to the presence of both oblate (disk-shaped) and prolate (rod-shaped) particles. (c) 3D paleogeographic model illustrating the weathering intensity that controls the magnetic mineral proportions between the late Maastrichtian and Eocene. In this study, sea level changes and MS vary independently. Both phyllosilicates and ferromagnetic minerals likely contribute to the MS signal. |
5.3 Implications for paleoenvironmental and paleoclimatic reconstructions at the Cretaceous/Paleogene transition
Our combined analyses of rock magnetism, mineralogy, and geochemistry show that MS in an adequate proxy of the long-term evolution of weathering intensity. Understanding the MS evolution has considerable implications for unraveling processes that drove the low MS signal in the decimeter-thick sediments immediately underlying the K-Pg boundary (e.g., Abrajevitch et al., 2015; Font et al., 2011; Lowrie et al., 1990). To explain this low MS interval, unresolved debates suggest a post-depositional dissolution of ferromagnetic minerals (Lowrie et al., 1990) or an increase in atmospheric and oceanic acidity linked to Deccan Traps volcanism (Abrajevitch et al., 2015) to explain this low susceptibility interval. The putative discovery of chloride-rich iron oxyhydroxides (i.e., akaganeite) in stratigraphic horizons of low MS values below the K-Pg boundary from three distinct European sections could confirm the latter view (Font et al., 2017). Primary akaganeite formation requires large concentrations of both dissolved ferrous iron and chloride ions, acidic and oxidizing conditions, and elevated temperatures (Johnston, 1977; Schwertmann and Cornell, 1991). Such conditions are typically observed in hydrothermal deposits of the Mid-Atlantic ridge (Bogdanov et al., 2008; Chavagnac et al., 2018). In contrast, the Late Cretaceous akaganeite could have been formed in the acidic and chloride-rich Deccan volcanic plume and subsequently transported several thousands of kilometers away as aerosols (Font et al., 2017). However, linking low MS values to global environmental acidification triggered by Deccan volcanism in stratigraphic horizons containing Cl-rich iron oxyhydroxides may not be straightforward. This is because the akaganeite formation and the mechanism responsible for the MS decrease could have occurred independently.
Our study emphasizes that the decrease of magnetic mineral content (i.e., lower MS values) immediately underlying the K-Pg boundary could now be interpreted differently, although no direct evidence for relationships between MS signal and weathering intensity over a few thousand years has so far been documented. This is further supported by previous assessments of CIA in the Yacoraite and Mingshui formations from northwestern Argentina and northeastern China, respectively (Gao et al., 2021; Rohais et al., 2019). These sediments have recorded a decrease in chemical weathering intensity prior to the K-Pg boundary. Furthermore, oxygen isotopic compositions of the Bidart (France) section correlated with those of the South Atlantic deep-sea site indicate a climate cooling in sediments containing the low MS interval during the last thousands of years of the Maastrichtian (Font et al., 2014; Li and Keller, 1998). Consequently, the weathering intensity could have decreased, leading to reduced delivery of magnetic minerals from land to the oceans. Therefore, it is important to use caution when interpreting MS data with regard to paleoenvironmental changes, such as global environmental acidification. The low weathering intensity and MS values before the K-Pg boundary could provide evidence of a mechanistic link between MS and weathering regime over thousand-year timescales.
6 Conclusion
Combined magnetic susceptibility, mineralogical, and geochemical investigations are presented here for the continuous Upper Cretaceous/Paleogene Erguita sedimentary sequence. Moderate chemical weathering would have facilitated the supply of magnetic detritus (both Fe-bearing phyllosilicates and ferromagnetic sensu lato minerals) to the oceans (Fig. 8c). These minerals may have been inherited from weathered parent rocks, sediments, or soils of the Anti-Atlas. Our observations hint that the evolution of magnetic susceptibility over millions of years in the Erguita section correlates with weathering intensity as a response to the Paleogene climate change. This work provides evidence for a new weathering proxy. We conclude that the Moroccan Erguita section could offer new insights into the origin of the low susceptibility zone at the K-Pb boundary.
Acknowledgments
Thanks to the scientific board of Geoscience Montpellier for supporting this work. The University of Mohammed VI Polytechnic is deeply thanked for field-trip logistics. We are grateful to Bernard Fraisse for his technical assistance during XRD measurements at RRXG platform of University of Montpellier. We would also like to thank Corine Reibel for her technical expertise and the MPMS measurements at IGCM.
Supplementary Material
Figure S1: XRD patterns of randomly oriented bulk powders of Erguita P-containing sediments. All XRD patterns are shown with the same intensity scale. All lithologies are presented
Figure S2: Raw magnetic susceptibility curve and associated rock magnetism dataset. Group 1 is composed of samples 28, 109, and 166. Group 2 is composed of samples 1 and 103, whereas Group 3 is only composed of sample 250. (I) Uncorrected (orange) and corrected (blue) hysteresis loop at room temperature. (II) Detail in blue of the corrected hysteresis loop. (III) Compilations of the ZFC, FC, RT-SIRM curves. (IV) ZFC curve (red) with its associated first derivative (blue). (V) RT-SIRM cycles. (VI) Detailed of the ZFC curve to observe the Verwey transition at ~120 K.
Figure S3: AMS fabric differentiated by the whole-rock Al2O3 content (right panels, <2 %; left panels, >2 %). In the Erguita section, the Al2O3 content reflects the clay mineral proportion. (a) Data plotted on a lower hemisphere stereonet projection. (b) Jelinek plot showing the shape parameter T versus the corrected degree of anisotropy P (Jelinek, 1981).
Figure S4: Scatter plots between U content, P2O5, and MS.
Table S1: GPS coordinates of sampled outcrops, including cylindric cores and oriented blocks.
Table S2: Uncertainty and detection limit of each analyzed element.
Table S3: U concentrations obtained by gamma-ray spectrometry.
Table S4: Mean MS values and associated standard deviations of the Erguita oriented cylindrical cores.
Table S5: XRD reflections and estimated CO32- contents (wt.%) of representative P-containing Erguita sediments. The carbonate concentration (wt.%) in CFA grains is calculated as 10.643x2 - 52.512x + 56.986 where x stands for ∆2𝞱(004-410).
Access Supplementary MaterialReferences
- Abrajevitch A, Font E, Florindo F, Roberts AP. 2015. Asteroid impact vs. Deccan eruptions: The origin of low magnetic susceptibility beds below the Cretaceous-Paleogene boundary revisited. Earth Planet Sci Lett 430: 209–223. [CrossRef] [Google Scholar]
- Alibo DS, Nozaki Y. 1999. Rare earth elements in seawater: particle association, shale-normalization, and Ce oxidation. Geochim Cosmochim Acta 63: 363–372. [CrossRef] [Google Scholar]
- Ambroggi R. 1963. Etude géologique du versant méridional du Haut Atlas occidental et de la plaine du Souss. Université de Paris, Paris. [Google Scholar]
- Aubineau J, Parat F, Chi Fru E, El Bamiki R, Mauguin O, Baron F, Poujol M, Séranne M. 2022a. Geodynamic seawater-sediment porewater evolution of the east central Atlantic Paleogene ocean margin revealed by U-Pb dating of sedimentary phosphates. Front Earth Sci 10: 997008. [CrossRef] [Google Scholar]
- Aubineau J, Parat F, Elghali A, Raji O, Addou A, Bonnet C, Muñoz M, Mauguin O, Baron F, Jouti MB, Yazami OK, Bodinier J-L. 2022b. Highly variable content of fluorapatite-hosted CO32− in the Upper Cretaceous/Paleogene phosphorites (Morocco) and implications for paleodepositional conditions. Chem Geol 597: 120818. [CrossRef] [Google Scholar]
- Aubineau J, Parat F, Pierson-Wickmann A-C., Séranne M, Fru EC, El Bamiki R, Elghali A, Raji O, Muñoz M, Bonnet C, Jourani E-S., Yazami OK, Bodinier J-L. 2024a. Phosphate δ13Corg chemostratigraphy from the Gantour basin, Morocco: a proof of concept from the K-Pg transition to mid-Thanetian. Chem Geol 121861. [Google Scholar]
- Aubineau J, Séranne M, Chi Fru E, Poujol M, El Bamiki R, Antonio PYJ, Muñoz M, Elghali A, Raji O, Jourani E-S., Bodinier J-L., Parat F. 2024b. Deciphering the U-Pb dates of sedimentary phosphates: a complex example from the Upper Cretaceous-Lower Paleogene series in northwestern Morocco. Chem Geol 661: 122178. [CrossRef] [Google Scholar]
- Aubourg C, Robion P. 2002. Composite ferromagnetic fabrics (magnetite, greigite) measured by AMS and partial AARM in weakly strained sandstones from western Makran, Iran. Geophys J Int 151: 729–737. [CrossRef] [Google Scholar]
- Aubourg C, Smith B, Bakhtari K, Guya N, Eshragi A, Lallemant S, Molinaro M, Braud X, Delaunay S. 2004. Post-Miocene shortening pictured by magnetic fabric across the Zagros-Makran syntaxis (Iran), in: Orogenic Curvature: Integrating Paleomagnetic and Structural Analyses, edited by A.J. Sussman, A.B. Weil. Geological Society of America Special paper, pp. 11–4à. [Google Scholar]
- Averbuch O, Tribovillard N, Devleeschouwer X, Riquier L, Mistiaen B, Van Vliet-Lanoe B. 2005. Mountain building-enhanced continental weathering and organic carbon burial as major causes for climatic cooling at the Frasnian-Famennian boundary (c. 376 Ma)? Terra Nova 17: 25–34. [CrossRef] [Google Scholar]
- Bau M, Dulski P. 1996. Distribution of yttrium and rare-earth elements in the Penge and Kuruman iron-formations, Transvaal Supergroup, South Africa. Precamb Res 79: 37–55. [Google Scholar]
- Bau M, Möller P, Dulski P. 1997. Yttrium and lanthanides in eastern Mediterranean seawater and their fractionation during redox-cycling. Mar Chem 56: 123–131. [CrossRef] [Google Scholar]
- Bilardello D. 2021. Late Paleozoic Depositional Environments and Sediment Transport Directions of the Itararé Group Rocks From the State of São Paulo, Brazil, Determined From Rock Magnetism and Magnetic Anisotropy. Earth Space Sci 8: e2021E A001703. [Google Scholar]
- Bilardello D, Jackson M. 2013. Cover article: What do the Mumpsies do? IRM Quarterly 23. [Google Scholar]
- Bogdanov YuA, Vikent’ev IV, Lein AYu, Bogdanova OYu, Sagalevich AM, Sivtsov AV. 2008. Low-temperature hydrothermal deposits in the rift zone of the Mid-Atlantic Ridge. Geol. Ore Deposits 50: 119–134. [CrossRef] [Google Scholar]
- Borradaile GJ, Puumala MA. 1989. Synthetic magnetic fabrics in a plasticene medium. Tectonophysics 164: 73–78. [CrossRef] [Google Scholar]
- Boulila S, de Rafélis M, Hinnov LA, Gardin S, Galbrun B, Collin P-Y. 2010. Orbitally forced climate and sea-level changes in the Paleoceanic Tethyan domain (marl-limestone alternations, Lower Kimmeridgian, SE France). Palaeogeogr Palaeoclimatol Palaeoecol 292: 57–70. [CrossRef] [Google Scholar]
- Boulila S, Galbrun B, Hinnov LA, Collin P-Y. 2008. Orbital calibration of the Early Kimmeridgian (southeastern France): implications for geochronology and sequence stratigraphy. Terra Nova 20: 455–462. [CrossRef] [Google Scholar]
- Brindley GW, Brown G. 1980. Crystal structure of clay minerals and their X-ray identification. Mineralogical Society, London. [Google Scholar]
- Burchette TP, Wright VP. 1992. Carbonate ramp depositional systems. Sediment Geol 79: 3–57. [Google Scholar]
- Carignan J, Hild P, Mevelle G, Morel J, Yeghicheyan D. 2001. Routine analyses of trace elements in geological samples using flow injection and low pressure on-line liquid chromatography coupled to ICP-MS: a study of geochemical reference materials BR, DR-N, UB-N, AN-G and GH. Geostandards Newsletter 25: 187–198. [CrossRef] [Google Scholar]
- Chadima M, Jelínek V. 2008. Anisoft 4.2. − Anisotropy data browser. Paleo, Rock and Environmental Magnetism, 11th Castle Meeting. Contrib Geophys Geodesy. [Google Scholar]
- Charton R, Bertotti G, Arnould AD, Storms JEA, Redfern J. 2021. Low‐temperature thermochronology as a control on vertical movements for semi‐quantitative source‐to‐sink analysis: a case study for the Permian to Neogene of Morocco and surroundings. Basin Res 33: 1337–1383. [CrossRef] [Google Scholar]
- Chavagnac V, Leleu T, Fontaine F, Cannat M, Ceuleneer G, Castillo A. 2018. Spatial Variations in Vent Chemistry at the Lucky Strike Hydrothermal Field, Mid-Atlantic Ridge (37°N): Updates for Subseafloor Flow Geometry From the Newly Discovered Capelinhos Vent. Geochem Geophys Geosyst 19: 4444–4458. [Google Scholar]
- Clarkson MO, Poulton SW, Guilbaud R, Wood RA. 2014. Assessing the utility of Fe/Al and Fe-speciation to record water column redox conditions in carbonate-rich sediments. Chem Geol 382: 111–122. [CrossRef] [Google Scholar]
- Cosmidis J, Benzerara K, Gheerbrant E, Estève I, Bouya B, Amaghzaz M. 2013. Nanometer-scale characterization of exceptionally preserved bacterial fossils in Paleocene phosphorites from Ouled Abdoun (Morocco). Geobiology 11: 139–153. [CrossRef] [Google Scholar]
- Crick RE, Ellwood BB, Hassani AE, Feist R, Hladil J. 1997. MagnetoSusceptibility Event and Cyclostratigraphy (MSEC) of the Eifelian-Givetian GSSP and associated boundary sequences in north Africa and Europe. Episodes J Int Geosci 20: 167–175. [CrossRef] [Google Scholar]
- Da Silva AC, De Vleeschouwer D, Boulvain F, Claeys P, Fagel N, Humblet M, Mabille C, Michel J, Sardar Abadi M, Pas D, Dekkers MJ. 2013. Magnetic susceptibility as a high-resolution correlation tool and as a climatic proxy in Paleozoic rocks − merits and pitfalls: examples from the Devonian in Belgium. Mar Petrol Geol 46: 173–189. [CrossRef] [Google Scholar]
- Da Silva A-C., Mabille C, Boulvain F. 2009. Influence of sedimentary setting on the use of magnetic susceptibility: examples from the Devonian of Belgium. Sedimentology 56: 1292–1306. [CrossRef] [Google Scholar]
- Da Silva A-C., Sinnesael M, Claeys P, Davies JHFL, de Winter NJ, Percival LME, Schaltegger U, De Vleeschouwer D. 2020. Anchoring the Late Devonian mass extinction in absolute time by integrating climatic controls and radio-isotopic dating. Sci Rep 10: 12940. [CrossRef] [Google Scholar]
- Da Silva AC, Whalen MT, Hladil J, Chadimova L, Chen D, Spassov S, Boulvain F, Devleeschouwer X. 2015. Magnetic susceptibility application: a window onto ancient environments and climatic variations: foreword. Geological Society, London, Special Publications 414: 1–13. [Google Scholar]
- Da Silva A-C., Yans J, Boulvain F. 2010. Sedimentology and magnetic susceptibility during the “punctata“ event of the Ardenne area (Belgium): identification of severe and rapid sea level fluctuations, in: Magnetic Susceptibility, Correlations and Palaeozoic Environments, edited by A.-C. Da Silva and F. Boulvain pp. 319-322. [Google Scholar]
- De Baar HJW, Brewer PG, Bacon MP. 1985. Anomalies in rare earth distributions in seawater: Gd and Tb. Geochim Cosmochim Acta 49: 1961–1969. [CrossRef] [Google Scholar]
- Dekkers MJ. 1989. Magnetic Properties of Natural Goethite—II. TRM behaviour during thermal and alternating field demagnetization and low-temperature treatment. Geophys J Int 97: 341–355. [CrossRef] [Google Scholar]
- Döebelin N, Kleeberg R. 2015. Profex: a graphical user interface for the Rietveld refinement program BGMN. J Appl Cryst 48: 1573–1580. [CrossRef] [Google Scholar]
- Dunlop DJ, Özdemir, Ö. (Eds.) 1997. Rock Magnetism: Fundamentals and Frontiers. Cambridge Studies in Magnetism. [Google Scholar]
- El Bamiki R, Raji O, Ouabid M, Elghali A, Khadiri Yazami O, Bodinier J-L. 2021. Phosphate rocks: a review of sedimentary and igneous occurrences in Morocco. Minerals 11: 1137. [CrossRef] [Google Scholar]
- El Bamiki R, Séranne M, Chellaï EH, Merzeraud G, Marzoqi M, Melinte-Dobrinescu MC. 2020. The Moroccan High Atlas phosphate-rich sediments: unraveling the accumulation and differentiation processes. Sediment Geol 403: 105655. [CrossRef] [Google Scholar]
- El Bamiki R, Séranne M, Parat F, Aubineau J, Chellaï EH, Marzoqi M, Bodinier J-L. 2023. Post-phosphogenesis processes and the natural beneficiation of phosphates: geochemical evidence from the Moroccan High Atlas phosphate-rich sediments. Chem Geol 631: 121523. [CrossRef] [Google Scholar]
- Ellouz N, Patriat M, Gaulier, J.-M., Bouatmani R, Sabounji S. 2003. From rifting to Alpine inversion: Mesozoic and Cenozoic subsidence history of some Moroccan basins. Sediment Geol 156: 185–212. [CrossRef] [Google Scholar]
- Ellwood BB, Crick RE, El Hassani A. 1999. The Magneto-Susceptibility Event and Cyclostratigraphy (MSEC) Method Used in Geological Correlation of Devonian Rocks from Anti-Atlas Morocco1. AAPG Bull 83: 1119–1134. [Google Scholar]
- Ellwood BB, Crick RE, Hassani AE, Benoist SL, Young RH. 2000. Magnetosusceptibility event and cyclostratigraphy method applied to marine rocks: detrital input versus carbonate productivity. Geology 28: 1135–1138. [CrossRef] [Google Scholar]
- Ellwood BB, El Hassani A, Tomkins JH, Bultynck P. 2015. A climate-driven model and development of a floating-point timescale for the middle devonian Eifelian stage using time-series analysis of magnetic susceptibility (x) data set, in: Magnetic Susceptibility Application − a Window onto Ancient Environments and Climatic Variations, edited by Da Silva AC, Whalen MT, Hladil J, Chadimova L, Chen D, Spassov S, Boulvain F, Devleeschouwer, X. [Google Scholar]
- Fedo CM, Babechuk MG. 2022. Petrogenesis of siliciclastic sediments and sedimentary rocks explored in three-dimensional Al2O3-CaO*+Na2O-K2O-FeO+MgO (A-CN-K-FM) compositional space. Can J Earth Sci 60: 818–838. [Google Scholar]
- Fedo CM, Wayne Nesbitt H, Young GM. 1995. Unraveling the effects of potassium metasomatism in sedimentary rocks and paleosols, with implications for paleoweathering conditions and provenance. Geology 23: 921–924. [CrossRef] [Google Scholar]
- Flinn D. 1978. Construction and computation of three-dimensional progressive deformations. J Geolog Soc 135: 291–305. [CrossRef] [Google Scholar]
- Font E, Carlut J, Rémazeilles C, Mather TA, Nédélec A, Mirão, J., Casale S. 2017. End-Cretaceous akaganéite as a mineral marker of Deccan volcanism in the sedimentary record. Sci Rep 7: 11453. [CrossRef] [Google Scholar]
- Font E, Fabre S, Nédélec A, Adatte T, Keller G, Viega-Pires C, Ponte J, Mirão, J., Khozyem H, Spangenberg JE. 2014. Atmospheric halogen and acid rains during the main phase of Deccan eruptions: magnetic and mineral evidence, in: Keller G, Kerr, A.C. (Eds.), Volcanism, Impacts, and Mass Extinctions: Causes and Effects. Geological Society of America pp. 353-368. [Google Scholar]
- Font E, Nédélec A, Ellwood BB, Mirão J, Silva PF. 2011. A new sedimentary benchmark for the Deccan Traps volcanism? Geophys Res Lett 38. https://doi.org/10.1029/2011GL049824 [Google Scholar]
- Frizon de Lamotte D, Zizi M, Missenard Y, Hafid M, El Azzouzi M, Maury RC, Charrière A, Taki Z, Benammi M, Michard A, 2008. The Atlas System, in: Michard, André, Saddiqi O, Chalouan A, Frizon de Lamotte, Dominique (Eds.), Continental Evolution: The Geology of Morocco: Structure, Stratigraphy, and Tectonics of the Africa-Atlantic-Mediterranean Triple Junction, Lecture Notes in Earth Sciences. Springer, Berlin, Heidelberg, pp. 133-202. [Google Scholar]
- Frizon de Lamotte DF, Leturmy P, Missenard Y, Khomsi S, Ruiz G, Saddiqi O, Guillocheau F, Michard A. 2009. Mesozoic and Cenozoic vertical movements in the Atlas system (Algeria, Morocco, Tunisia): an overview. Tectonophysics 475: 9–28. [Google Scholar]
- Gao Y, Ibarra DE, Caves Rugenstein JK, Chen J, Kukla T, Methner K, Gao Y, Huang H, Lin Z, Zhang L, Xi D, Wu H, Carroll AR, Graham SA, Chamberlain CP, Wang C. 2021. Terrestrial climate in mid-latitude East Asia from the latest Cretaceous to the earliest Paleogene: a multiproxy record from the Songliao Basin in northeastern China. Earth-Sci Rev 216: 103572. [CrossRef] [Google Scholar]
- Garnit H, Bouhlel S, Barca D, Chtara C. 2012. Application of LA-ICP-MS to sedimentary phosphatic particles from Tunisian phosphorite deposits: Insights from trace elements and REE into paleo-depositional environments. Geochemistry 72: 127–139. [CrossRef] [Google Scholar]
- Girard C, Feist R, Mossoni A, Cornée J-J., Camps P, Charruault A-L., Corradini C. 2021. North-Gondwana − Laurussia dynamic paleogeography challenged by magnetic susceptibility through the Famennian. Gondwana Res 97: 263–272. [CrossRef] [Google Scholar]
- Herbig H-G., Trappe J. 1994. Stratigraphy of the Subatlas Group (Maastrichtian − Middle Eocene, Morocco). Newsl Stratigr 125–165. [CrossRef] [Google Scholar]
- Hillier S. 2000. Accurate quantitative analysis of clay and other minerals in sandstones by XRD: comparison of a Rietveld and a reference intensity ratio (RIR) method and the importance of sample preparation. Clay Minerals 35: 291–302. [CrossRef] [Google Scholar]
- Hladil J. 2002. Geophysical records of dispersed weathering products on the Frasnian carbonate platform and early Famennian ramps in Moravia, Czech Republic: proxies for eustasy and palaeoclimate. Palaeogeogr Palaeoclimatol Palaeoecol 181: 213–250. [CrossRef] [Google Scholar]
- Jelinek V. 1981. Characterization of the magnetic fabric of rocks. Tectonophysics 79: T63– T67. [CrossRef] [Google Scholar]
- Jian X, Guan P, Zhang W, Feng F. 2013. Geochemistry of Mesozoic and Cenozoic sediments in the northern Qaidam basin, northeastern Tibetan Plateau: implications for provenance and weathering. Chem Geol 360-361: 74–88. [CrossRef] [Google Scholar]
- Johnston JH. 1977. Jarosite and akaganéite from White Island volcano, New Zealand: an X-ray and Mössbauer study. Geochim Cosmochim Acta 41: 539–544. [CrossRef] [Google Scholar]
- Knidiri A, Daoudi L, El Ouahabi M, Rhouta B, Rocha F, Fagel N. 2014. Palaeogeographic controls on palygorskite occurrence in Maastrichtian-Palaeogene sediments of the Western High Atlas and Meseta Basins (Morocco). Clay Minerals 49: 595–608. [CrossRef] [Google Scholar]
- Kocsis L, Gheerbrant E, Mouflih M, Cappetta H, Yans J, Amaghzaz M. 2014. Comprehensive stable isotope investigation of marine biogenic apatite from the late Cretaceous-early Eocene phosphate series of Morocco. Palaeogeogr Palaeoclimatol Palaeoecol 394: 74–88. [CrossRef] [Google Scholar]
- Kosterov A. 2002. Low-temperature magnetic hysteresis properties of partially oxidized magnetite. Geophys J Int 149: 796–804. [CrossRef] [Google Scholar]
- Lanari R, Fellin MG, Faccenna C, Balestrieri ML, Pazzaglia FJ, Youbi N, Maden C. 2020. Exhumation and surface evolution of the Western High Atlas and surrounding regions as constrained by low-temperature thermochronology. Tectonics 39: e2019T C005562. [Google Scholar]
- Leprêtre R, Missenard Y, Barbarand J, Gautheron C, Jouvie I, Saddiqi O. 2018. Polyphased Inversions of an Intracontinental Rift: case study of the Marrakech High Atlas, Morocco. Tectonics 37: 818–841. [CrossRef] [Google Scholar]
- Li L, Keller G. 1998. Maastrichtian climate, productivity and faunal turnovers in planktic foraminifera in South Atlantic DSDP sites 525A and 21. Mar Micropaleontol 33: 55–86. [CrossRef] [Google Scholar]
- Lowrie W, Alvarez W, Asaro F. 1990. The origin of the White Beds below the Cretaceous-Tertiary boundary in the Gubbio section, Italy. Earth Planet Sci Lett 98: 303–312. [CrossRef] [Google Scholar]
- Mahboubi A, Cornée, J.-J., Feist R, Camps P, Girard C. 2019. Frasnian (Upper Devonian) integrated facies analysis, magnetic susceptibility and sea-level fluctuations in the NW Algerian Sahara. Geolog Mag 156: 1295–1310. [CrossRef] [Google Scholar]
- McClellan GH, Van Kauwenbergh SJ. 1991. Mineralogical and chemical variation of francolites with geological time. J Geolog Soc 148: 809–812. [CrossRef] [Google Scholar]
- Mead GA, Tauxe L, LaBrecque JL. 1986. Oligocene paleoceanography of the South Atlantic: Paleoclimatic implications of sediment accumulation rates and magnetic susceptibility measurements. Paleoceanography 1: 273–284. [CrossRef] [Google Scholar]
- Meunier A, Caner L, Hubert F, Albani AE, Prêt D. 2013. The weathering intensity scale (WIS): An alternative approach of the Chemical Index of Alteration (CIA). Am J Sci 313: 113–143. [CrossRef] [Google Scholar]
- Michard A, Saddiqi O, Chalouan A, Frizon de Lamotte D. 2008. Continental Evolution: The Geology of Morocco. Springer, Berlin, Heidelberg. [CrossRef] [Google Scholar]
- Missenard Y, Saddiqi O, Barbarand J, Leturmy P, Ruiz G, El Haimer F-Z., Frizon de Lamotte D. 2008. Cenozoic denudation in the Marrakech High Atlas, Morocco: insight from apatite fission-track thermochronology. Terra Nova 20: 221–228. [Google Scholar]
- Morin FJ. 1950. Magnetic susceptibility of α Fe2O3 and α Fe2O3 with added titanium. Phys Rev 78: 819–820. [CrossRef] [Google Scholar]
- Nathan Y. 1984. The Mineralogy and Geochemistry of Phosphorites, in: Nriagu JO, Moore, P.B. (Eds.), Phosphate Minerals. Berlin, Heidelberg: Springer-Verlag, pp. 275-291. [Google Scholar]
- Nesbitt HW, Young GM, 1982. Early Proterozoic climates and plate motions inferred from major element chemistry of lutites. Nature 299: 715–717. [CrossRef] [Google Scholar]
- Nguidi MA, Mouflih M, Benbouziane A, Kocsis L, El Ouariti S, El Boukhari H, Aquit M, Yazami OK. 2021. Lithofacies analysis, sedimentary dynamics and genesis of Maastrichtian-Eocene phosphorites of BouCraa deposit (Southern Morocco). J Afr Earth Sci 177: 104161. [CrossRef] [Google Scholar]
- Nowaczyk NR, Minyuk P, Melles M, Brigham-Grette J, Glushkova O, Nolan M, Lozhkin AV, Stetsenko TVM, Andersen P, Forman SL. 2002. Magnetostratigraphic results from impact crater Lake El’gygytgyn, northeastern Siberia: a 300 kyr long high-resolution terrestrial palaeoclimatic record from the Arctic. Geophys J Int 150: 109–126. [CrossRef] [Google Scholar]
- Özdemir Ö, Dunlop DJ. 2010. Hallmarks of maghemitization in low-temperature remanence cycling of partially oxidized magnetite nanoparticles. J Geophys Res: Solid Earth 115. https://doi.org/10.1029/2009JB006756 [Google Scholar]
- Özdemir Ö, Dunlop DJ. 2005. Thermoremanent magnetization of multidomain hematite. J Geophys Res: Solid Earth 110. https://doi.org/10.1029/2005JB003820 [Google Scholar]
- Özdemir Ö, Dunlop DJ, Moskowitz BM. 2002. Changes in remanence, coercivity and domain state at low temperature in magnetite. Earth Planet Sci Lett 194: 343–358. [CrossRef] [Google Scholar]
- Pas D, Da Silva A-C., Poulain G, Spassov S, Boulvain F. 2019. Magnetic Susceptibility Record in Paleozoic Succession (Rhenohercynian Massif, Northern Europe) − Disentangling Sea Level, Local and Diagenetic Impact on the Magnetic Records. Front Earth Sci 7. [Google Scholar]
- Paterson GA, Zhao X, Jackson M, Heslop D. 2018. Measuring, processing, and analyzing hysteresis data. Geochem Geophys Geosyst 19: 1925–1945. [CrossRef] [Google Scholar]
- Potter DK, Stephenson A. 1988. Single-domain particles in rocks and magnetic fabric analysis. Geophys Res Lett 15: 1097–1100. [CrossRef] [Google Scholar]
- Pufahl PK, Groat LA. 2017. Sedimentary and igneous phosphate deposits: formation and exploration: an invited paper. Econ Geol 112: 483–516. [CrossRef] [Google Scholar]
- Reynard B, Lécuyer C, Grandjean P. 1999. Crystal-chemical controls on rare-earth element concentrations in fossil biogenic apatites and implications for paleoenvironmental reconstructions. Chem Geol 155: 233–241. [CrossRef] [Google Scholar]
- Riquier L, Averbuch O, Devleeschouwer X, Tribovillard N. 2010. Diagenetic versus detrital origin of the magnetic susceptibility variations in some carbonate Frasnian-Famennian boundary sections from Northern Africa and Western Europe: implications for paleoenvironmental reconstructions. Int J Earth Sci (Geol Rundsch) 99: 57–73. [CrossRef] [Google Scholar]
- Robinson SG. 1986. The late Pleistocene palaeoclimatic record of North Atlantic deep-sea sediments revealed by mineral-magnetic measurements. Phys Earth Planetary Interiors 42: 22–47. [CrossRef] [Google Scholar]
- Rohais S, Hamon Y, Deschamps R, Beaumont V, Gasparrini M, Pillot D, Romero-Sarmiento, M-F. 2019. Patterns of organic carbon enrichment in a lacustrine system across the K-T boundary: insight from a multi-proxy analysis of the Yacoraite Formation, Salta rift basin, Argentina. Int J Coal Geol 210: 103208. [CrossRef] [Google Scholar]
- Schneider J, Bechstädt T, Machel HG. 2004. Covariance of C- and O-isotopes with magnetic susceptibility as a result of burial diagenesis of sandstones and carbonates: an example from the Lower Devonian La Vid Group, Cantabrian Zone, NW Spain. Int J Earth Sci (Geol Rundsch) 93: 990–1007. [CrossRef] [Google Scholar]
- Schuffert JD, Kastner M, Emanuele G, Jahnke RA. 1990. Carbonate-ion substitution in francolite: a new equation. Geochim Cosmochim Acta 54: 2323–2328. [CrossRef] [Google Scholar]
- Schwertmann U, Cornell RM. 1991. Iron Oxides in the Laboratory: Preparation and Characterization. John Wiley & Sons. [Google Scholar]
- Shields G, Stille P. 2001. Diagenetic constraints on the use of cerium anomalies as palaeoseawater redox proxies: an isotopic and REE study of Cambrian phosphorites. Chemical Geology, Response of the Oceanic / Atmospheric Systems to Past Global Changes 175: 29–48. [Google Scholar]
- Singer A, Galan E. 1984. Palygorskite-Sepiolite: Occurrences, Genesis and Uses. Amsterdam: Elsevier. [Google Scholar]
- Środoń J, Eberl DD. 1984. Illite, in: Review in Mineralogy Vol. 13, Micas, edited by S.W. Bailey. Mineralogical Society of America, Washington DC, pp. 495-544. [Google Scholar]
- Stage M. 2001. Magnetic susceptibility as carrier of a climatic signal in chalk. Earth Planet Sci Lett 188: 17–27. [CrossRef] [Google Scholar]
- Tauxe L, Gee JS, Staudigel H. 1998. Flow directions in dikes from anisotropy of magnetic susceptibility data: the bootstrap way. J Geophys Res 103: 17775–17790. [CrossRef] [Google Scholar]
- Taylor SN, Lagroix F, Rousseau D-D., Antoine P. 2014. Mineral magnetic characterization of the Upper Pleniglacial Nussloch loess sequence (Germany): an insight into local environmental processes. Geophys J Int 199: 1463–1480. [CrossRef] [Google Scholar]
- Taylor SR, McLennan SM. 1985. The continental crust: Its composition and evolution. Blackwell Scientific Publications, Oxford. [Google Scholar]
- Vanderaveroet P, Averbuch O, Deconinck J-F., Chamley H. 1999. A record of glacial/interglacial alternations in Pleistocene sediments off New Jersey expressed by clay mineral, grain-size and magnetic susceptibility data. Marine Geol 159: 79–92. [CrossRef] [Google Scholar]
- Velde B, Suzuki T, Nicot E. 1986. Pressure-temperature-composition of illite/smectite mixed-layer minerals: Niger delta mudstones and other examples. Clays Clay Minerals 34: 435–441. [CrossRef] [Google Scholar]
- Verwey E. 1935. The crystal structure of γ-Fe2O3 and γ-Al2 O3. Zeitsch Kristallogr Crystalline Mater. 91: 65–69. [CrossRef] [Google Scholar]
- Walker JCG, Hays PB, Kasting JF. 1981. A negative feedback mechanism for the long-term stabilization of Earth’s surface temperature. J Geophys Res: Oceans 86: 9776–9782. [CrossRef] [Google Scholar]
- Walker RG, James NP. 1992. Facies Models: Response to Sea Level Change. Geological Association of Canada, Geotext. ed. [Google Scholar]
- Warr LN. 2022. Earth’s clay mineral inventory and its climate interaction: a quantitative assessment. Earth-Sci Rev 234: 104198. [CrossRef] [Google Scholar]
- Westerhold T, Marwan N, Drury AJ, Liebrand D, Agnini C, Anagnostou E, Barnet JSK, Bohaty SM, De Vleeschouwer D, Florindo F, Frederichs T, Hodell DA, Holbourn AE, Kroon D, Lauretano V, Littler K, Lourens LJ, Lyle M, Pälike H, Röhl U, Tian J, Wilkens RH, Wilson PA, Zachos JC. 2020. An astronomically dated record of Earth’s climate and its predictability over the last 66 million years. Science 369: 1383–1387. [Google Scholar]
- Whalen MT, Day JE. (Jed). 2010. Cross-Basin Variations in Magnetic Susceptibility Influenced by Changing Sea Level, Paleogeography, and Paleoclimate: Upper Devonian, Western Canada Sedimentary Basin. J Sedimentary Res 80: 1109–1127. [Google Scholar]
- Wouters S, Spassov S, Martinez M, Steurbaut E, Storme J-Y., Yans J, Devleeschouwer X. 2019. Depositional changes during the Danian-Selandian transition in Loubieng (France), Zumaia (Spain) and Sidi Nasseur (Tunisia): insights from and limits of rock magnetism. Geolog Mag 156: 1982–2000. [Google Scholar]
- Zhang R, Kravchinsky VA, Zhu R, Yue L. 2010. Paleomonsoon route reconstruction along a W-E transect in the Chinese Loess Plateau using the anisotropy of magnetic susceptibility: Summer monsoon model. Earth Planet Sci Lett 299: 436–446. [CrossRef] [Google Scholar]
Cite this article as: Aubineau J, Antonio PYJ, El Bamiki R, Parat F, Camps P, Raji O, Jourani E-S, Bodinier J-L, Macouin M, Gilder S, Rousse S, Séranne M. 2024. Magnetic susceptibility controlled by climate-driven weathering intensity, BSGF - Earth Sciences Bulletin 195: 25.
All Tables
Semi-quantification of the mineralogical assemblages in the Erguita sediments. Data were obtained after careful examination of bulk XRD patterns.
Major and trace element compositions and CIA values of representative Erguita sediments.
All Figures
|
Fig. 1 (a) Simplified structural map of the western High Atlas in Morocco, modified from El Bamiki et al. (2020). (b) Detailed lithostratigraphic column of the Erguita section with interpreted regressive and transgressive trends. (c) Gamma-ray curve showing the U content within the sediments. It is assumed that U reflects the proportion of phosphate minerals because of their great incorporation of trace elements, including U, compared to carbonates, sandstones, and marls (Aubineau et al., 2022a; Nathan, 1984). |
| In the text | |
|
Fig. 2 Facies and sedimentological features. (a) Gypsum layers (arrows) in the basal Erguita section. (b) Massive P-rich carbonated sandstones. Note that these rocks are sometimes crumbly. (c) Hummocky cross-stratification. (d) Finning-upward gravity-flow deposit. (e) Nautiloid. (f) Turritella and Oenopota gastropods. (g) Massive shell bed composed of oyster fragments. (h) Alternating carbonates and clayey calcarenites in the uppermost part of the section. (i) Example of oriented cylindrical cores consisting of P-rich calcarenite. Arrows show mm-sized, unsorted phosphatic grains. Scale bar: 5 cm. Sample number is indicated in the white rectangle. Coin diameters: 2.4 cm in (d, f) and 2.7 cm in (e). Hammer and pen lengths: 33 and 15 cm, respectively. |
| In the text | |
|
Fig. 3 Rock-magnetism data of the Erguita sediments. (a) Group 1 corresponding to single-domain to pseudo-single-domain magnetite. (b) Group 2 corresponding to superparamagnetic magnetite. (c) Group 3 corresponding to a mixture of iron oxides and iron oxyhydroxide minerals. Left panel, ZFC (zero field cooled) curve with the apparent Verwey transition (Tv); middle panel, mass-normalized RT-SIRM cycles, warming (in red) and cooling (in blue); right panel, uncorrected (orange) and corrected (blue) hysteresis loops. |
| In the text | |
|
Fig. 4 (a) Magnetic susceptibility curve (SI) with interpreted transgressive-regressive trends in the Upper Cretaceous/Paleogene succession at Erguita. The red line corresponds to the mean MS values, while the black line is the mean MS values with one standard deviation. Legend of the lithostratigraphic column is on Figure 1. The stratigraphy is based on El Bamiki et al. (2020). (b) Scatter plot between the chemical index of alteration and magnetic susceptibility. P-rich sediments are not shown because their formation falsifies the CIA values. |
| In the text | |
|
Fig. 5 Relationship between the proportion of most abundant mineral phases and magnetic susceptibility in the Erguita sediments. Linear regressions are shown without the incorporation of negative MS values. |
| In the text | |
|
Fig. 6 Scatter plots showing the relationships between Al and MS (a), Fe and MS (b), Al and Fe (c), and Zr and MS (d). |
| In the text | |
|
Fig. 7 REEY geochemistry of the Erguita section. (a) Average PAAS-normalized REEY patterns compared to modern seawater (Alibo and Nozaki, 1999). Light (L)REE (La to Nd), Middle (M)REE (Sm to Dy), and Heavy (H)REE (Ho to Lu). Geochemical data of PAAS are from Taylor and McLennan (1985). (b) Sm/Yb)SN vs. (Sm/Pr)SN, after Garnit et al. (2012). Data of SW are from Alibo and Nozaki (1999). (c) Ce anomaly vs. Pr anomaly, after Bau and Dulski (1996). (d) Cross plot between Y/Ho and Zr showing the source of REE within the depositional environments. The Y/Ho ratios indicate a mixing source of REE. |
| In the text | |
|
Fig. 8 (a) Data plotted on a lower hemisphere stereonet projection showing the magnetic grain fabric. This projection derives from the AMS ellipsoid (for a comprehensive illustration see Zhang et al. (2010) and Bilardello (2021). Kmin is vertical and Kmax and Kint axes are randomly distributed within the horizontal plane, which indicates deposition of particles under gravity only. (b) Flinn diagram (Flinn, 1978) of AMS data showing a minimum degree of anisotropy due to the presence of both oblate (disk-shaped) and prolate (rod-shaped) particles. (c) 3D paleogeographic model illustrating the weathering intensity that controls the magnetic mineral proportions between the late Maastrichtian and Eocene. In this study, sea level changes and MS vary independently. Both phyllosilicates and ferromagnetic minerals likely contribute to the MS signal. |
| In the text | |
Current usage metrics show cumulative count of Article Views (full-text article views including HTML views, PDF and ePub downloads, according to the available data) and Abstracts Views on Vision4Press platform.
Data correspond to usage on the plateform after 2015. The current usage metrics is available 48-96 hours after online publication and is updated daily on week days.
Initial download of the metrics may take a while.