")
")
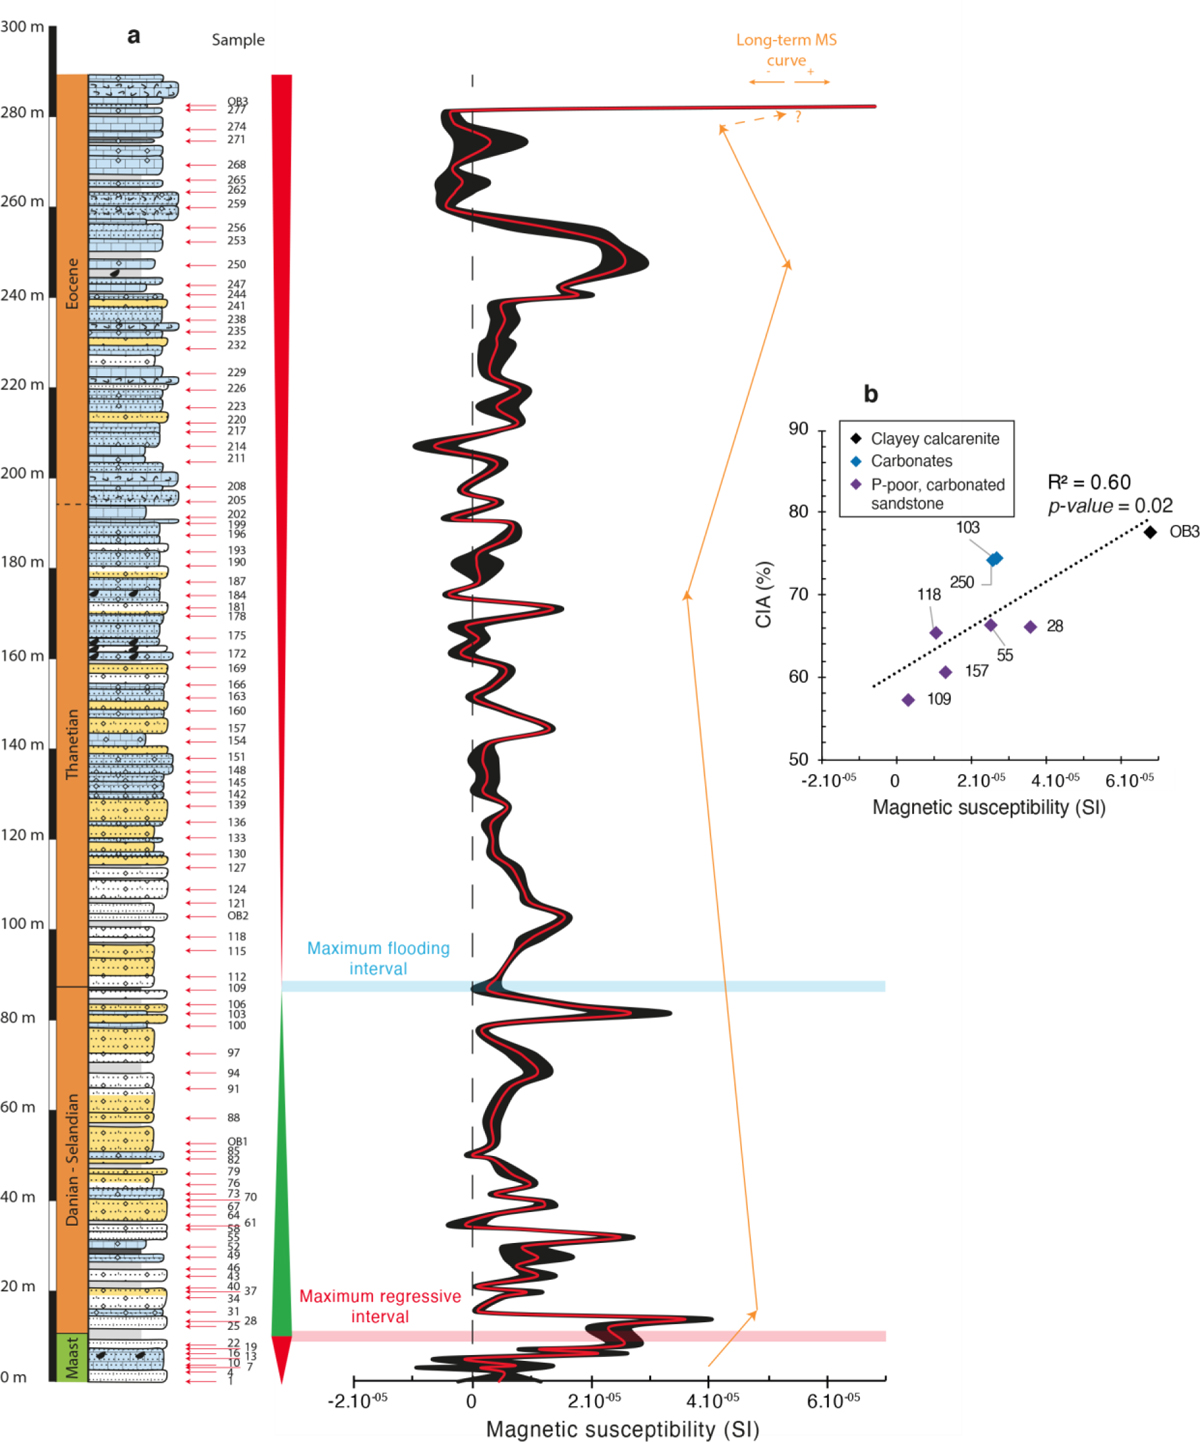
Fig. 4
Download original image
(a) Magnetic susceptibility curve (SI) with interpreted transgressive-regressive trends in the Upper Cretaceous/Paleogene succession at Erguita. The red line corresponds to the mean MS values, while the black line is the mean MS values with one standard deviation. Legend of the lithostratigraphic column is on Figure 1. The stratigraphy is based on El Bamiki et al. (2020). (b) Scatter plot between the chemical index of alteration and magnetic susceptibility. P-rich sediments are not shown because their formation falsifies the CIA values.
Current usage metrics show cumulative count of Article Views (full-text article views including HTML views, PDF and ePub downloads, according to the available data) and Abstracts Views on Vision4Press platform.
Data correspond to usage on the plateform after 2015. The current usage metrics is available 48-96 hours after online publication and is updated daily on week days.
Initial download of the metrics may take a while.