")
")
| Issue |
BSGF - Earth Sci. Bull.
Volume 196, 2025
|
|
|---|---|---|
| Article Number | 9 | |
| Number of page(s) | 19 | |
| DOI | https://doi.org/10.1051/bsgf/2025007 | |
| Published online | 03 June 2025 | |
Geological and S–Pb–He–Ar isotope constraints on the origin of the Muping–Rushan gold belt, Jiaodong Peninsula, eastern China
1
Hebei Key Laboratory of Strategic Critical Mineral Resources, Hebei GEO University, Shijiazhuang, PR China
2
Tianjin Geological Survey Center, China Geological Survey, Tianjin, PR China
3
Yantai Coastal Zone Geological Survey Center, China Geological Survey, Yantai, PR China
4
School of Civil Engineering, Shandong Jianzhu University, Jinan, PR China
* e-mail: This email address is being protected from spambots. You need JavaScript enabled to view it.
Received:
2
September
2024
Accepted:
15
March
2025
Abstract
The Muping–Rushan gold belt is one of three gold mineralization belts in Jiaodong Peninsula, eastern China, comprising between the Sulu ultrahigh-pressure metamorphic belt and North China Craton. This study investigates the source of gold and ore-forming fluids in the Muping–Rushan gold belt, based on a detailed analyses of typical gold deposits. Electron microprobe elemental mapping of pyrite and pyrrhotite shows that gold and silver occur mainly as thin veins in cracks in stage I pyrite (Py1) or around stage II pyrite (Py2). The arsenic contents are higher at the rims and in cracks of stage I pyrite (Py1) and around stage II pyrite (Py2), and are positively correlated with gold contents. In situ sulphur isotope data for sulphides in the study area range between 5.8‰ and 10.1‰. The sulphides in the belt are generally character ised by δ34SPy > δ34SSp > δ34SCcp and δ34SPy4 > δ34SPy2 > δ34SPy1. The δ34S values of mineralization stages II and III are similar to those of the Jiaodong and Jingshan Groups and the Kunyushan Complex. Lead isotopic compositions are consistent with those of the lower crust and orogenic belts. 3He/4He, 40Ar/36Ar, and 40Ar*/4He ratios of the gold deposits in the study area are 0.01–5.06 Ra, 389.8–4674.7, and 0.03–2.78, respectively, indicating that the ore-forming fluids were derived mainly from the crust, with a minor mantle contribution.
Key words: Jiaodong Peninsula / Muping–Rushan gold belt / Elemental mapping / In situ sulphur isotopes / Lead isotopes / Helium and argon isotopes
© J.-T. He et al., Published by EDP Sciences 2025
 This is an Open Access article distributed under the terms of the Creative Commons Attribution License (https://creativecommons.org/licenses/by/4.0), which permits unrestricted use, distribution, and reproduction in any medium, provided the original work is properly cited.
1 Introduction
Jiaodong Peninsula is the largest gold producing province in China (Deng et al., 2018; Goldfarb and Groves, 2015). The proven gold reserves exceeded 5500 tons in 2023, and these reserves and production account for ∼25% of the total reserves and production in China (Deng et al., 2023; Song et al., 2023; Yang et al., 2019). The Muping–Rushan gold belt is one of three gold mineralization belts on Jiaodong Peninsula (Figs. 1–2), with >80 gold deposits (Fan et al., 2016; Song, 2012). The single-vein gold reserves in the Jinqingding gold deposit are >40 tons.
Globally, the distribution of orogenic and magmatic-hydrothermal gold deposits is mainly controlled by the continental or oceanic arc system (Groves et al., 2019). The Jiaodong gold province is hosted by a Precambrian metamorphic basement that originated in the Paleoproterozoic and was metamorphosed by continental collision in the Triassic. Afterward, it entered an intracontinental setting that underwent anatectically-induced reworking from the Jurassic to the Cretaceous, with peak reworking ages between 120 and 130 Ma (Zheng et al., 2013; Zheng and Wu, 2018; Zheng et al., 2019). This led to a superimposed metallogenic environment and current metallogenic models related to plate theory have not fully interpreted it (Deng et al., 2023; Zheng et al., 2013; Zheng, 2023). unlike other typical gold deposits, such as Mother Lode in the USA, Olympiada and Sukhoi Log in Russia, Timmins in Canada, Golden Mile and Bendigo in Australia, and Yangshan and Huachanggou in China, which typically exhibit close temporal and spatial relationships with regional metamorphism (Deng et al., 2020a; Gebre-Mariam et al., 1995; Goldfarb et al., 2001; Goldfarb et al., 2005; Goldfarb and Groves, 2015; Groves et al., 1987; Groves et al., 2000; Kerrich et al., 2005; Li et al., 2006; Phillips and Powell, 2010), the Jiaodong gold province was formed at ca. 120 Ma (Chen, 2017; Deng et al., 2022; Hu et al., 2004; Li et al., 2006; Sai et al., 2020; Yang and Zhou, 2001), with a significant time gap following the previous Precambrian regional metamorphic events. Given these unique features and other metallogenic attributes, the gold deposits in this region have been referred to as the “Jiaodong-type” (Deng et al., 2015; Li and Santosh, 2014; Zhai et al., 2004; Zhai and Santosh, 2013), atypical orogenic gold deposits (Goldfarb et al., 2001; Goldfarb et al., 2005; Yang et al., 2014; Yang et al., 2016), or as a unique orogenic gold deposit type(Goldfarb and Santosh, 2014).
Fluids are important in ore-forming processes, which enabling energy transfer and the transport and exchange of ore materials. Fluid migration can also expand the ore-forming space. The formation, migration, and evolution of fluids, as well as the deposition from fluids, reflect the entire ore-forming process (Mao et al., 1999; Xu et al., 1999). According to the scale of gold reserves, the Muping–Rushan gold belt contains both large- and medium-sized gold deposits, such as the Tangjiagou, Dengezhuang, Jinniushan, Yingezhuang, Jinqingding, Fuludi, Hubazhuang, Sanjia, Shicheng, Hujiakou, Gegezhuang, Chahe, Tongxishan, and Congjia gold deposits, along with tens of smaller deposits (Figs. 1–2). Previous research in the study area (Chen, 2010; Cui, 2012; Li, 2011; Zhang et al., 2002; Zhang et al., 2012; Zhou, 2010), has focused mainly on the Jinqingding, Denggezhuang, and Yinggezhuang gold deposits, while little attention was given to the Tangjiagou, Jinniushan and Shicheng gold deposits, which are controlled by nearly NE-trending faults. A paucity of systematic studies on the characteristics of ore fluids, isotope geochemistry, and timing of metallogenesis in Muping–Rushan gold belt has resulted in controversy/uncertainly regarding the age of mineralization, the source of the ore-forming fluids, and the genesis of the ore deposits. Moreover, conventional bulk analysis yields unusual sulphur isotope compositions, complicating genetic modeling. Due to the limited constraints on the pyrite paragenesis in isotope analysis and the pronounced fluid-rock interaction observed in the Muping–Rushan gold belt, current stable isotope investigations do not provide sufficient evidence for metal and fluid sources or genesis.
Considering the absence of electron microprobe elemental mapping for the Jinqingding, Denggezhuang, Yinggezhuang gold deposits and the lack of in situ sulphur isotope analysis for the Yinggezhuang gold deposit, even though previous research has been carried out. The source of the metals and the generation of auriferous fluids remain unclear. These factors significantly restrict the systematic study of the Muping–Rushan gold belt. To match the diverse geological facts, it is necessary to analyse the regional tectono-metallogenic background, lithospheric architecture, and gold mineralization processes in detail. Therefore, this study investigated typical gold deposits in the Muping–Rushan gold belt (Tangjiagou, Denggezhuang, Jinniushan, Yinggezhuang, Jinqingding, and Shicheng) using elemental mapping, and in situ sulphur, lead, and helium–argon isotope analysis. These data, combined with previous studies, are used to constrain the source of the ore-forming materials and the origins of the Muping–Rushan gold belt.
 |
Fig. 1 Regional distribution of Muping–Rushan gold belt and simplified geological map of the Jiaodong area. (a) Tectonic subdivision of the Shandong Peninsula (modified after (He et al., 2021; Tang et al., 2008)); (b) Simplified geological map of the Jiaodong area (modified after (Fan et al., 2016; Song, 2012)). KYS-Kunyushan granitic complex, SFS-Sanfoshan granite, DGS-Duogushan granodiorite, WD-Wendeng granite, WDS-Weideshan granite, JZS-Jiazishan complex. |
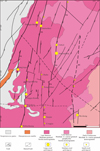 |
Fig. 2 Geological sketch map of the Muping–Rushan gold belt. F1 Qinghushan–Tangjiagou Fault, F2 Jinniushan Fault, F3 Chahe–Sanjia Fault, F4 Jiangjunshi–Quhezhuang Fault, F5 Majiazhuang–Gekou Fault. |
2 Regional geological and mineralization setting
Jiaodong Peninsula, located on the southeastern margin of the North China Craton (Fig. 1a), is bounded to the south by the Sulu ultrahigh-pressure (UHP) metamorphic belt and to the west by the Tanlu Fault (Fig. 1b). The Jiaodong Peninsula is geologically divided into two distinct terranes by the Muping–Jimo Fault which which marks the suture the Yangtze and North China cratons (He et al., 2021; Li et al., 2013; Song, 2012; Zhang et al., 2008): the Jiaodong terrane, located to the southeast, and the Jiaobei terrane, situated to the northwest. The southeastern Jiaodong terrane is composed of Mesozoic igneous rocks, Lower Cretaceous volcanic and sedimentary rocks, and UHP gneisses. These UHP gneisses are primarily amphibolite-facies granitic gneisses, with subordinate occurrences of eclogites and mafic rocks (He et al., 2021; Yang et al., 2005). The Mesozoic igneous rocks include the Kunyushan granitic complex, Sanfoshan granite, Duogushan granodiorite, Wendeng granite, Weideshan granite, and Jiazishan complex, which were intruded into the UHP gneisses (He et al., 2021).
The study area is part of the Qinling–Dabie mineralization province (II-2), Tongbai–Dabie–Sulu mineralization region (III-3), southeast Shandong mineralization sub-region (IV-6), Wendeng–Weihai small mineralization region (V-13), and Mouping–Rushan gold–silver–molybdenum–iron mineralization belt (VI-50) (Song et al., 2015). The Muping–Rushan gold belt primarily refers to the zone bounded by the Muping–Jimo and Mishan faults. There are three mineralization types in the Jiaodong area: Jiaojia-type (altered rock-type), Linglong-type (quartz–sulphide vein-type), and Pengjiakuang-type (breccia-type) (Mao et al., 2008; Yang et al., 2014). The Muping–Rushan gold belt contains Linglong-type gold deposits, which are vein-like or lenticular and hosted in high-angle brittle faults that developed within Late Jurassic granites. These ore bodies are strictly controlled by NE–SW-trending faults. The main ore-bearing wall rocks of the Muping–Rushan gold belt are the Kunyushan granitic complex, along with the western margins of the Queshan and Sanfoshan granites.
A series of NE–SW-trending faults control the gold deposits of the Muping–Rushan gold belt, which are the Qinghushan–Tangjiagou (F1), Jinniushan (F2), Jiangjunshi–Quhezhuang (F3), Chahe–Sanjia (F4), and Gekou (F5) faults from west to east. These faults are subparallel, nearly equidistant, with strikes of 005°–025° and dips of 75°–90°SE (Fig. 2). The ore bodies are vein-like or lenticular, parallel to the faults, and locally have an en echelon form.
3 Ore deposit geology
The representative gold deposits examined in this study are the Tangjiagou, Denggezhuang, Jinniushan, Yinggezhuang, Jinqingding, and Shicheng deposits. The geological features of these deposits are provided in Supplementary Table 1. The Jinqingding gold deposit controlled by the Jiangjunshi-Quhezhuang Fault, is the largest single-vein gold deposit in China, and the most intensively studied among those considered here. The Denggezhuang gold deposit is controlled by a secondary fault of the Jinniushan Fault and holds the second largest reserves in the region. The Jinniushan and Yinggezhuang gold deposits are located along the southern and northern sections, respectively of the Jinniushan Fault. The Qinghushan–Tangjiagou and Majiazhuang–Gekou faults, located on the western and eastern margins of the study area, respectively, controlled the locations of the Tangjiagou and Shicheng gold deposits. The deposits examined in this research occur in both the eastern and western parts of the gold belt and are associated with various primary and secondary faults.
The Muping–Rushan ores are dominated by pyrite, followed by native gold, electrum, pyrrhotite, galena, chalcopyrite, sphalerite, and secondary hematite. The principal gangue mineral is quartz, followed by sericite and calcite. The gold ores are primary in origin. The ores have panidiomorphic–hypidiomorphic granular, brecciated, interstitial, and mosaic textures, and blocky, vein, network, disseminated, and brecciated forms.
Due to the steepness of the ore-controlling faults, zoning of alteration related to mineralization is relatively obvious. The zoning is centred on the ore bodies, and comprises pyrite–phyllic alteration→ sericite–K-feldspar granite → K-feldspar granite → granite. There are gradual transitions between the altered rock zones.
The mineral assemblage of typical gold deposits in the Muping–Rushan gold belt is relatively consistent, and the differences are mainly in the polymetallic sulphide stage and the carbonate stage. For example, pyrrhotite is more abundant in the polymetallic sulphide stage of the Tangjiagou gold deposit, galena is more abundant in the polymetallic sulphide stage of the Denggezhuang and Jinnushan gold deposits, chalcopyrite is more abundant in the polymetallic sulphide stage of the Shicheng gold deposit, and the characteristic siderite is found in the carbonate stage of the Shicheng gold deposit. Based on the mineral assemblages, four mineralisation stages are identified for the gold deposits in the study, as follows (Fig. 3):
Stage I (pyrite–milky quartz stage): Hand specimens show milky panidiomorphic–hypidiomorphic, coarse-grained quartz–pyrite veins with comb-like and miarolitic textures (Fig. 4e). This stage was characterised by coarse-grained milky quartz (Fig. 5d, h, n; Fig. 6d, i) and a small amount of panidiomorphic, cubic, coarse-grained pyrite (Fig. 5a, c, e, g, i, j, m; Fig. 6a, e, g, j, k, l). The mineralization is extensive, but the gold content and grade are low.
Stage II (dark quartz–pyrite stage): Hand specimens contain dark quartz–pyrite veins that cut the earlier milky quartz-pyrite veins (Fig. 4a, d). This stage was dominated by pyrite formation, which appears as hypidiomorphic–allomorphic fine-grained aggregates and single pentagonal–dodecahedral crystals (Fig. 5a, g, m; Fig. 6a, e, h). Locally, stage I pyrite (Py1) is cut and/or transformed into stage II pyrite (Py2) (Fig. 5m). The dark quartz occurs as allomorphic aggregates along the rims and in cracks of stage I milky quartz (Fig. 5d, h, n; Fig. 6d, f, i). In this stage, the quartz is less abundant, whereas gold is more concentrated than stage I.
Stage III (polymetallic sulphide stage): The mineral assemblage at this stage consists mainly of pyrite, galena, sphalerite, chalcopyrite, pyrrhotite, and quartz (Fig. 5b, c, k; Fig. 6a, g). The pyrite is anhedral (Fig. 5b) and fine-grained, and forms massive to banded ores with associated sulphides. Sphalerite includes chalcopyrite exsolution blebs (Fig. 5c). Compared with stage II, the contents of precious metal contents are significantly lower, and the mineralization intensity and spatial extent are also lower. However, it was also an important stage for gold formation, which is mainly found in the shallow parts of ore bodies and has no obvious boundary with the stage II mineralization.
Stage IV (pyrite–calcite stage): As fluid temperatures declined, calcite was precipitated, marking the end of mineralisation. This stage was dominated by the formation of panidiomorphic calcite, along with small amounts of panidiomorphic quartz and pyrite (Fig. 4c, f). The pyrite has a cubic form and quartz–calcite aggregates filling fractures (Fig. 5f, o; Fig. 6c, f, i).
 |
Fig. 3 Paragenetic sequence of hydrothermal minerals in the Muping–Rushan gold belt. Minerals’ relative abundance is represented by the thickness of solid lines (thick = abundant, thin = less abundant, dashed = least abundant). |
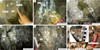 |
Fig. 4 Representative photographs showing mineral paragenesis of the ore from the Muping–Rushan gold belt. |
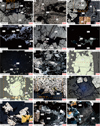 |
Fig. 5 Representative photomicrographs of samples from the Tangjiagou and Dengezhuang gold deposits. (a) Assemblage of pyrite (Py1+Py2) (RPPL); (b) Pyrrhotite (Po) was cut by pyrite (Py3) (RPPL); (c) Sphalerite (Sp) contained pyrite (Py1) and chalcopyrite (Ccp) blebs were distributed along the pyrite (Py1) boundaries and fractures (RPPL); (d) Quartz (Qtz1) was cut by an aggregate of quartz (Qtz2) and calcite (Cal) filling fractures (TXPL); (e) Assemblage of pyrite (Py1+Py4) (RPPL); (f) Calcite (Cal) and quartz (Qtz4) filling fractures (TXPL); (g) Cube pyrite (Py1) and pyritohedron pyrite (Py2) (RPPL); (h) Quartz (Qtz2) was distributed along the quartz (Qtz1) boundaries and fractures (TXPL); (i) and (j) Large pyrite crystal (Py1) (RPPL); (k) Pyrrhotite (Po) is replaced by chalcopyrite (Ccp) (RPPL); (l) Euhedral cube pyrite (Py4) (RPPL); (m) Py1 was cut by Py2 (RPPL); (n) Quartz (Qtz2) was distributed along the quartz (Qtz1) boundaries and fractures (TXPL); (o) Assemblage of quartz (Qtz4) and calcite (Cal) (TXPL). Red circle points show the locations of in situ sulphur isotope spots. The orange dotted frame show the locations of EPMA mapping. RPPL: reflected plane-polar ised light, TXPL: transmitted crossed-polar ised light. |
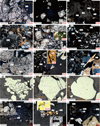 |
Fig. 6 Representative photomicrographs of samples from the Yinggezhuang, Jinniushan, Jinqingding and Shicheng gold deposits. (a) Chalcopyrite (Ccp) filling the fractures of cube pyrite (Py1) and pyritohedron pyrite (Py2) (RPPL); (b) Euhedral cube pyrite (Py4) (RPPL); (c) Assemblage of quartz (Qtz4) and calcite (Cal) (TXPL); (d) Quartz (Qtz2) was distributed along the quartz (Qtz1) boundaries and fractures (TXPL); (e) Cube pyrite (Py1) and pyritohedron pyrite (Py2) (RPPL); (f) Quartz (Qtz2) was distributed along the quartz (Qtz1) boundaries and fractures (TXPL); (g) Pyrite (Py1) is replaced by chalcopyrite (Ccp) (RPPL); (h) Large pyrite crystal (Py1) and fine-grain pyrite (Py2) (RPPL); (i) The boundary between quartz (Qtz2, left) was distributed along the quartz (Qtz1, right) (TXPL); (j), (k), (l) Large pyrite crystal (Py1) (RPPL); (m) Cube pyrite (Py1) and pyritohedron pyrite (Py2) (RPPL); (n) Pyrite (Py1) is replaced by chalcopyrite (Ccp) (RPPL+TXPL); (o) Siderite (Sd), Pyrite (Py4) and quartz (Qtz4) filling fractures (RPPL+TXPL). Red circle points show the locations of in situ sulphur isotope spots. The orange dotted frame show the locations of EPMA mapping. RPPL: reflected plane-polar ised light, TXPL: transmitted crossed-polar ised light. |
4 Samples and analytical methods
4.1 Sample preparation
All studied samples (n = 21) are fresh ores from different mineralisation stages of the Tangjiagou, Denggezhuang, Jinniushan, Yinggezhuang, Jinqingding, and Shicheng gold deposits. Detailed sample information is provided in Supplementary Table 2. The selected ore samples were prepared as double-sided polished sections (300–900 µm thick) for microscopic observations, and target minerals (i.e., sulphides) for electron microprobe analysis and elemental mapping and in situ sulphur isotope analysis were identified. Seven samples were used for electron microprobe elemental mapping, 16 samples for in situ sulphur isotope analysis, 8 samples for lead isotope analysis, and 9 samples for helium–argon isotope analysis.
4.2 Electron micprobe analysis
Electron microprobe analysis was conducted at the Tianjin Geological Survey Center, China Geological Survey, Tianjin, China, using a Shimadzu EPMA-1600 instrument. Experimental conditions were: accelerating voltage = 15 kV, primary beam current = 60 nA, secondary beam current = 40 nA, and beam diameter = 2 µm. The detection limits were: Ag = 80 ppm, Au = 350 ppm, As = 250 ppm, Fe = 200 ppm, and S = 70 ppm.
4.3 In situ sulphur isotope analysis
In situ sulphur isotopic compositions were determined with a 193nm ArF excimer laser ablation system (RESOlution S-155) coupled to an MC–ICP–MS (Nu Plasma II) at the State Key Laboratory for Geological Processes and Mineral Resources, China University of Geosciences, Wuhan, China. The analyses were conducted with a laser spot size of 33 µm, a repetition rate of 8 Hz, and an energy density of 3–5 J/cm2. An in-house pyrite standard (WS-1) and United States Geological Survey standard (sphalerite NBS-123) were used to correct mass bias of the S isotopes. The δ34SV-CDT value obtained for WS-1 was 0.3‰ ± 0.1‰ (Zhu et al., 2017). The δ34SV-CDT value obtained for NBS-1 was 18.2‰ ± 0.2‰ (Hu et al., 2003). The analytical procedures were described by Liu et al. (2018).
4.4 Lead isotope analysis
Lead isotope analysis was performed at the Analytical Laboratory, Beijing Research Institute of Uranium Geology, Beijing, China. Samples of 0.1–0.2 g of pyrite (60–80 mesh) were precisely weighed and dissolved in low-pressure, closed Teflon beakers in HF + HNO3 + HClO4. The lead was separated by anion exchange methods, and analysed by thermal ionisation mass spectrometry with an accuracy of better than ±0.005%. The lead isotope ratios were corrected for mass fractionation by the NIST SRM 981 lead standard.
4.5 Helium and argon isotope analysis
Helium and argon isotope analysis was conducted using an inert gas isotope ratio mass spectrometer (MI-1201IG; Ukraine) at the Institute of Mineral Resources, Chinese Academy of Geological Sciences, Beijing, China. The pyrite was crushed to 20–60 mesh and handpicked under a binocular microscope to a purity exceeding 99%. 3He ions were measured with an electron multiplier, and 4He ions were measured with a Faraday collector. Beijing air was used as the standard (3He/4He = 1.399 × 10⁻⁶). The He blank (at 1600°C) is 4He = 2 × 10⁻¹¹ cm3 STP, with 3He/4He = 1 × 10⁻⁶. The standard yielded an accuracy of ±1%. Analytical procedures followed those of Li et al. (2002).
5 Results
5.1 Elemental mapping
The Ag, Au, As, Fe, and S elemental maps for pyrite and pyrrhotite in seven samples are presented in Supplementary Figure 1.
5.2 In situ sulphur isotopes
Fourteen samples (66 analyses) were chosen for in situ sulphur isotope analysis. The data are shown in Figs 5–6 and summarised in Supplementary Table 3.
δ34SV-CDT values of the Tangjiagou gold deposit are 8.2‰–9.5‰ (n = 2) for stage I pyrite, 9.2‰–9.3‰ (n = 2) for stage II pyrite, 6.6‰–7.1‰ (n = 2) for stage III chalcopyrite, 5.3‰–7.7‰ (n = 3) for stage III sphalerite, 6.8‰–6.9‰ (n = 3) for stage III pyrrhotite, and 7.0‰–7.2‰ (n = 2) for stage IV pyrite. δ34SV-CDTvalues of the Dengezhuang gold deposit are 4.9‰–9.4‰ (n = 12) for stage I pyrite, 6.9‰–9.8‰ (n = 2) for stage II pyrite, 6.6‰–7.1‰ (n = 3) for stage III pyrrhotite, and 11.6‰–11.9‰ (n = 2) for stage IV pyrite. δ34SV-CDT values of the Jinniushan gold deposit are 8.8‰–9.0‰ (n = 3) for stage II pyrite, 4.0‰–5.7‰ (n = 3) for stage III chalcopyrite, and 9.7‰–12.5‰ (n = 2) for stage IV pyrite. δ34SV-CDT values of the Yinggezhuang gold deposit are 9.6‰–10.3‰ (n = 3) for stage II pyrite and 8.1‰–9.6‰ (n = 3) for stage III chalcopyrite. δ34SV-CDT values of the Jinqingding gold deposit are 9.6‰–10.2‰ (n = 12) for stage I pyrite and 7.6‰–8.1‰ (n = 3) for stage II pyrite. δ34SV-CDT values of the Shicheng gold deposit are 4.1‰–4.8‰ (n = 2) for stage II pyrite and 6.0‰–7.7‰ (n = 2) for stage IV pyrite.
5.3 Lead isotopes
Lead isotope data for eight samples from the Tangjiagou and Jinniushan gold deposits are summar ised in Supplementary Table 4. The Tangjiagou gold deposit has 206Pb/204Pb = 17.056–17.354, 207Pb/204Pb = 15.404–15.580, and 208Pb/204Pb = 37.457–38.107. The Jinniushan gold deposit has 206Pb/204Pb = 17.015–17.025, 207Pb/204Pb = 15.430–15.437, and 208Pb/204Pb = 37.385–37.434. Lead isotopic compositions are relatively homogeneous. Model ages of the Tangjiagou and Jinniushan gold deposits are 758–1010 and 962–976 Ma, respectively. The µ and ω values derived from a single-stage model for normal lead are 9.27–9.62 and 38.02–40.05 for the Tangjiagou gold deposit, and 9.33–9.35 and 38.65–38.97 for the Jinniushan gold deposit, respectively.
5.4 Helium and argon isotopes
Helium–argon isotope data for nine samples of the Tangjiagou, Jinniushan, and Shicheng gold deposits are summar ised in Supplementary Table 5. The Tangjiagou gold deposit has 3He = 6.96–14.2 cm3 STP, 4He = 2.29–5.17 cm3 STP, 3He/4He = 1.24–2.17 Ra, 40Ar/36Ar = 389.8–685.7, and 40Ar = 0.316–1.170 cm3 STP. The Jinniushan gold deposit has 3He = 1.34–11.61 cm3 STP, 4He = 0.69–3.99 cm3 STP, 3He/4He = 1.39–2.08 Ra, 40Ar/36Ar = 455.3–587.43, and 40Ar = 3.504–10.494 cm3 STP. The Shicheng gold deposit has 3He = 28.15–90.44 cm3 STP, 4He = 13.72–27.87 cm3 STP, 3He/4He = 1.47–2.45 Ra, 40Ar/36Ar = 836.9–869.6, and 40Ar = 0.951–2.507 cm3 STP. The Tangjiagou, Jinniushan, and Shicheng gold deposits contain 18.82%–33.35%, 21.09%–31.79%, and 22.33%–35.49% mantle helium, respectively.
6 Discussion
6.1 Slphide fatures
In the Muping–Rushan gold belt, the ore minerals are mainly pyrite, followed by native gold, electrum, chalcopyrite, pyrrhotite, sphalerite, galena, and secondary hematite. The gangue minerals are mainly quartz, followed by sericite and calcite. Chalcopyrite is most common in the Shicheng gold deposit. The ores of the Muping–Rushan gold belt have panidiomorphic–hypidiomorphic granular, brecciated, interstitial, and mosaic textures, and blocky, vein, network, disseminated, and brecciated forms.
Different mineral assemblages in the various types of ores formed by hydrothermal activity define four mineralisation stages: the pyrite–milky quartz stage (stage I), dark quartz–pyrite stage (stage II), polymetallic sulphide stage (stage III), and pyrite–calcite stage (stage IV). Based on cross-cutting relationships between minerals, the formation sequence is quartz (Qtz1) → pyrite (Py1) → quartz (Qtz2) → pyrite (Py2) → polymetallic sulphides (pyrite [Py3]–sphalerite–chalcopyrite–galena) → pyrite (Py4) → quartz (Qtz4) → calcite–siderite.
The As elemental maps for the Tangjiagou gold deposit (Supp. Fig. 1a, b) show the crystal rims and cracks in Py1, and rims of stage II and III sulphides are enriched in As. High As contents character ise the rims of Py1 in the Tangjiagou and Denggezhuang gold deposits. Some pyrite grains exhibit arsenic zoning (Supp. Fig. 1a, c). Silver and gold in samples of the Jinniushan, Yinggezhuang, and Jinqingding gold deposits occur mainly in cracks in Py1 or at the rims of stage II and III sulphides (Supp. Fig. 1e, f, g, h). This indicates that pyrite with high As contents formed mainly between late stage I to III, and that As and Au contents are positively correlated. There are no significant differences in the pyrite Fe and S contents in the different mineralization stages. However, the Fe–S elemental maps for the Denggezhuang, Jinniushan, and Jinqingding gold deposits (Supp. Fig. 1d, e, h) show that the pyrite rims are Fe–S-poor, which is probably resulting from oxidative leaching of these elements.
6.2 Sources of the ore-forming materials
The migration and precipitation of gold is closely related to H2S, and S is eventually incorporated into metallic sulphides. As such, sulphide sulphur isotope data can trace the gold source(s). δ34S values of the Muping–Rushan gold belt are mainly 5.8‰–10.1‰ (Supp. Table 3). The sulphides are generally characterised by δ34SPy > δ34SSp > δ34SCcp and δ34SPy4 > δ34SPy2 > δ34SPy1 (Fig. 7). These patterns indicate isotopic equilibrium with regard to sulphur isotope composition in the Muping–Rushan gold belt, and that the δ34S values closely approximate those of the ore-forming fluids (Ohmoto and Goldhaber, 1997).
δ34S values of the Kunyushan granitic complex and Jingshan and Jiaodong groups are 3.8‰–15.3‰, 8.2‰–12.0‰, and 6.1‰–7.8‰, respectively (An et al., 1988; Li and Yang, 1993; Wang et al., 2002; Xu, 1986; Yang et al., 1998; Zhang and Chen, 1999). δ34S values of Py1, Py2, and the stage III polymetallic sulphides overlap those of the Kunyushan granitic complex and Jingshan and Jiaodong groups (Fig. 7). δ34S values of Py4 are elevated and resemble those of those of the Jingshan Group.
δ34S values of the main mineralization period (i.e., stages II and III) are as follows: Tangjiagou gold deposit = 5.3‰–9.3‰; Denggezhuang gold deposit = 2.1‰–9.8‰; Jinniushan gold deposit = 4.0‰–9.0‰; Yinggezhuang gold deposit = 8.1‰–10.2‰; Jinqingding gold deposit = 5.0‰–8.1‰; and Shicheng gold deposit = 4.1‰–4.8‰. The δ34S values are relatively uniform, and differ from mantle-derived sulphur (0‰), but are similar to sulphur in intermediate to silicic igneous rocks (–13.4‰ to 26.7‰) (Zhang et al., 2013). The δ34S values of the gold deposits are slightly higher than values in mafic basement rocks (–4.0‰ to 4.0‰) and the Jiaodong Group (Department Of Geochemistry, 1979). This shows the ore-forming materials in the Muping–Rushan gold belt are of mixed source. Following sulphur dissolution in the strata, homogenization of sulphur isotopes and ore formation occurred, which resulted in higher δ34S values. The ore-forming processes involved multi-stage enrichment. Therefore, it is inferred that during the main mineralization period (stages II and III), sulphur was derived from the Kunyushan granitic complex and the Jingshan and Jiaodong groups. With fluid evolution, δ34S values increased. This indicates that the Kunyushan granitic complex and the Jingshan and Jiaodong groups could have provided the ore-forming material, and had different contributions to the different generations of sulphide. The variable sulphur isotopic compositions of the sulphide minerals may reflect sulphur isotope fractionation.
Lead isotopes can be used to constrain magma sources, but for ore deposits indicate the source of ore-forming materials (Ding et al., 2013; Zhang, 1988; Zhao et al., 2007; Zhu et al., 1998). Ore minerals, include pyrite, galena, and sphalerite, typically contain little or no U and Th and there is no apparent accumulation of radiogenic lead after mineralization. The lead isotopic composition of ores is mainly a function of the µ (238U/204Pb), ω (232Th/204Pb), Th/U ratios and the age of the source(s) of ore-forming materials (An et al., 1988; Wu et al., 2002; Zhang, 1988).
Lead isotope data for the Denggezhuang, Yinggezhuang, Jinqingding, and Shicheng gold deposits were compiled from earlier studies (Chen, 2010; Cui, 2012; Li, 1992; Li, 2011; Yang, 2000; Yang and Lv, 1996; Zhou, 2010). Lead isotope data for the Kunyushan granitic complex and Jiaodong Group were also compiled from the literature (Chen, 1989; Hu, 2006; Wang, 1988; Xu, 1986; Yang and Lv, 1996). All lead isotope data are summarised in Supplementary Table 4.
The sulphide lead isotopic compositions in the Muping-Rushan gold belt are relatively homogeneous, showing consistent variations for each deposit (Fig. 8), reflecting a common lead source. The gold deposits in the study area have 206Pb/204Pb = 16.939–17.920, 207Pb/204Pb = 15.305–15.838, and 208Pb/204Pb = 37.050–38.736. The calculated source µ value is 9.07–10.12, which is much higher than average crustal lead (8.99 ± 0.07), and the ω value is 36.07–46.49, which is also higher than average crustal lead (35.55 ± 0.59). The Th/U ratio is 3.79–4.47, exceeding typical mantle values (3.45), but similar to that of the crust (3.92 ± 0.09) (Stacey and Kramers, 1975).
In a tectonic discrimination diagram based on lead isotopes (Fig. 8a, b), the Muping–Rushan gold belt falls predominantly within the lower crust field. In a 206Pb/204Pb–208Pb/204Pb diagram (Fig. 8c), the samples from the study area plot above the orogenic belt field and mantle evolution curve, and near the lower crustal evolution curve. On a Δβ–Δγ classification diagram (Fig. 8d), the Muping–Rushan gold belt plots mostly in the orogenic lead field, consistent with indicative of a genetic relationship the tectonic setting of the study area. The Kunyushan granitic complex and Jiaodong Group have similar Pb isotopic compositions as the Muping–Rushan gold belt (Fig. 8), indicative of a genetic relationship between these rocks and the gold deposits.
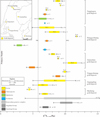 |
Fig. 7 Compilation of δ34S isotope data for sulphides from the Muping–Rushan gold belt. The Kunyushan granitic complex δ34S data from (An et al., 1988; Li and Yang, 1993; Yang et al., 1998). The Jingshan group δ34S data from (Zhang and Chen, 1999). The Jiaodong group δ34S data from (Li and Yang, 1993; Wang et al., 2002; Xu, 1986; Yang et al., 1998). |
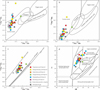 |
Fig. 8 Diagrams of lead isotope ratios for sulphides from Muping–Rushan gold belt. (a) 206Pb/204Pb vs. 207Pb/204Pb; (b) 206Pb/204Pb vs. 208Pb/204Pb; (c) 206Pb/204Pb vs. 208Pb/204Pb Pb isotope evolution diagram; (d) Δβ vs. Δγ genetic classification diagram. Boundaries in diagrams of (a), (b), (c) are after Zartman and Doe (1981). Boundaries in diagrams of (d) are after Zhu et al. (1998). Denggezhuang gold deposit lead isotope data from (Cui, 2012; Yang and Lv, 1996). Yinggezhuang gold deposit lead isotope data from (Zhou, 2010). Jinqingding gold deposit lead isotope data from (Chen, 2010; Li, 1992; Li, 2011; Yang, 2000). The Kunyushan granitic complex lead isotope data from (Hu, 2006; Wang, 1988; Xu, 1986; Yang and Lv, 1996). The Jiaodong group lead isotope data from (Chen, 1989; Wang, 1988). Δβ = 1000×β / (βM-1), Δγ = 1000×γ / (γM-1). β, γ, βM, γM are 207Pb/204Pb and 208Pb/204Pb for sample and mantle, respectively. |
6.3 Source of the ore-forming fluids
Due to the chemical inertness of the noble gases, they can remain unchanged during geological processes. Sources of geological fluids can be inferred from the noble gases. Helium isotope ratios of fluids from different sources exhibit relatively large differences, especially the 3He/4He ratios of crustal helium (3He/4He = 0.01–0.05 Ra; average = 0.02 Ra) and mantle helium (3He/4He = 6–9 Ra; average = 6.5 Ra). Given that pyrite and other sulphides have a low diffusion coefficient for helium, the helium in pyrite inclusions will not be lost after being captured (Ballentine and Burnard, 2002; Burnard and Polya, 2004). Therefore, helium and argon isotopes can trace the fluid source(s).
Helium and argon isotope data for the Denggezhuang, Yinggezhuang, and Jinqingding gold deposits were compiled from previous studies (Xue et al., 2013; Zhang et al., 2002; Zhang et al., 2012; Zhou, 2010). The helium and argon isotope data are summarised in Supplementary Table 5. 3He/4He ratios of the Muping–Rushan gold belt are 0.01–5.06 Ra, 40Ar/36Ar ratios are 389.8–4674.7, and 40Ar*/4He ratios are 0.03–2.78. Compared with air-saturated water, crustal fluids and mantle fluids, the fluid composition is intermediate between crust- and mantle-derived fluid, and the 40Ar/36Ar values of some samples approach atmospheric values. Argon from the mantle and radiogenic argon have high 40Ar/36Ar ratios.
Prior studies indicate that mantle-derived fluid has 40Ar*/4He = 0.33–0.56 (Dunai and Baur, 1995; Patterson et al., 1994; Porcelli et al., 1992; Reid and Graham, 1996), and crust-derived fluid has 40Ar*/4He = 0.2 (Andrews, 1985; Fontes et al., 1991). However, the 40Ar*/4He values of some samples from the Denggezhuang, Jinniushan, Yinggezhuang, and Jinqingding gold deposits are above those of the mantle and crust. Therefore, the radiogenic argon of these samples with high 40Ar/36Ar and 40Ar*/4He ratios is mainly of atmospheric origin.
In a 4He–3He diagram (Fig. 9a), the Muping–Rushan gold belt lies between the crustal and mantle helium fields, but closer to the crustal field, reflecting a mixed source for the ore-forming fluids. In a 40Ar/36Ar–R/Ra diagram (Fig. 9b), further supporting a mixed fluid origin. The ratio of 3He/4He in the ore-forming fluid is as high as 3.61 Ra, which reflects mantle-derived He. Data for the Tangjiagou, Denggezhuang, and Jinniushan gold deposits has characteristics indicative of involvement of meteoric waters. In a 40Ar*/4He–R/Ra diagram (Fig. 9c), the data also plot between the crust- and mantle-derived fields.
According to a binary mixing model, the proportion of mantle-derived He in the Tangjiagou, Denggezhuang, Jinniushan, Yinggezhuang, Jinqingding, and Shicheng gold deposits is 18.82%–33.25% (average = 27.35%), 4.43%–55.47% (average = 28.15%), 21.09%–31.79% (average = 26.05%), 0.26%–5.99% (average = 3.93%). 1.16%–6.87% (average = 2.78%), and 22.33%–35.49% (average = 31.78%), respectively (Supp. Table 5). These results (Fig. 9) demonstrate that the proportions of mantle-derived He in the Yinggezhuang and Jinqingding gold deposits are much lower than in the Tangjiagou, Denggezhuang, Jinniushan, and Shicheng gold deposits. The lower proportions of mantle-derived He are probably related to fluids sourced from the deep part of faults, and crustal thickening and extrusion in the study area. They may also result from mixing with high contents of crust-derived He in the fluid, which results in dilution of the mantle-derived component (Zhao et al., 2010).
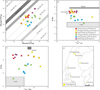 |
Fig. 9 Helium and argon isotope diagrams of fluid inclusions from the Muping–Rushan gold belt. (a) 4He vs. 3He diagram (modified after (Mamyrin and Tolstikhin, 1984)); (b) 40Ar/36Ar vs. R/Ra diagram (modified after (Burnard et al., 1999)); (c) 40Ar*/4He vs. R/Ra diagram (modified after (Hu et al., 1997)); (d) Location of typical gold deposits. Denggezhuang gold deposit He-Ar isotope data from (Xue et al., 2013; Zhang et al., 2002). Yinggezhuang gold deposit He-Ar isotope data from (Zhou, 2010). Jinqingding gold deposit He-Ar isotope data from (Zhang et al., 2012). R is the 3He/4He ratio of sample; Ra is the 3He/4He ratio of atmosphere (Ra=1.399×10⁻⁶) (Mamyrin et al., 1970). The magmatic field is summarised by Goodwin et al. (2017). (d) Simple map of the Muping–Rushan gold belt showing deposit localities. |
6.4 Mineralization model for the Muping–Rushan gold belt
Gold deposits in the Jiaodong area are similar to orogenic gold deposits (Goldfarb et al., 2001; Zhou et al., 2002), but exhibit some clear differences (Goldfarb and Santosh, 2014; Guo et al., 2013). The host rocks of the Muping–Rushan gold belt in the Jiaodong area are the Late Jurassic Kunyushan granitic complex. The vein ore bodies have developed upon NE–SW-trending faults.
Sulphur and lead isotope data for stage I and II sulphides in the Muping–Rushan gold belt are consistent with the Kunyushan granitic complex, and Jingshan and Jiaodong groups, and the data for stage III polymetallic sulphides are more similar to those of the Jiaodong Group. Stage IV pyrite is more similar to the Jingshan Group. The data are indicative of lower crustal and orogenic belt sources (Figs. 7, 8). The Muping–Rushan gold belt is mainly situated at the transition between the North China Craton and Sulu UHP metamorphic belt, consistent with the sulphur and lead isotope data. In addition, a Hf–Nd isotope study showed that the average crustal model age of the Kunyushan granitic complex is consistent with that of Archean TTGs in the North China Craton. The source rocks of the Kunyushan granitic complex are mainly the Archean Jiaodong Group (Wu et al., 2005; Yang et al., 2006) and mafic lower crust of the Yangtze Craton (Hu, 2006). Due to the gold deposition process, the effects of redox reactions and other processes on the sulphur isotopic compositions is ≤1‰ (Goldfarb and Groves, 2015). Therefore, it is inferred that the ore-forming materials in the study area were principally derived from the Jingshan and Jiaodong groups.
Helium and argon isotope data indicate that the ore-forming fluids in the study area were mainly derived from the crust, and partly from the mantle (Fig. 9), which is consistent with the lead isotope data (Fig. 8). Geochemical and geological data indicate that the boundary between the North China and Yangtze cratons is the NE–SW-trending Muping–Jimo fault system that cuts the basement rocks (Zhang et al., 2008). These deep faults likely acted as conduits for the crust- and mantle-derived ore-forming fluids in the Muping–Rushan gold belt.
Due to the subduction of the Paleo-Pacific Plate in the Middle Jurassic, the tectonic setting in eastern China experienced a major tectonic shift (Isozaki, 1997; Maruyama et al., 1997; Quan et al., 2020; Zhu et al., 2016). Local ised extension and large-scale magmatism occurred in the study area during the Late Jurassic, reflecting weak back-arc extension (Dang et al., 2022; Zhu et al., 2016; Zhu and Xu, 2019). Evidence for the local tectonic indicators suggest that N–S extension persisted from the Late Cretaceous to Paleocene (Zhang et al., 2008). The mineralization ages of the Muping–Rushan gold belt are mainly concentrated between 113.3 and 104.8 Ma, and thus it is inferred that the gold deposits originated in an extensional back-arc setting linked to subduction of the Palaeo-Pacific Plate.
Enrichment of the lithospheric mantle by ore metals and fluids can be achieved by a number of processes: (1) released from the subducting slab and overlying sediments (Deng et al., 2020a; Goldfarb and Santosh, 2014; Groves et al., 2020); and (2) retention of metals in previously fertil ised and hydrated lithospheric mantle (Wang et al., 2020; Zhao et al., 2019). Sulphur isotope data for gold-related sulphide minerals may be able to help differentiate between the two mechanisms.
Based on the results and the regional geological evolution, the formation of the Muping–Rushan gold belt is inferred to have occurred as follows (Fig. 10). Firstly, in the Late Jurassic, subduction of the Palaeo-Pacific Plate released water and other volatiles from the plate and overlying sediments, resulting in hydration of the lithospheric mantle. due to oceanic slab subduction, the Kunyushan granitic complex formed between 160 and 140 Ma (He et al., 2021). Secondly, during the Early Cretaceous (120–100 Ma), the Sanfoshan granite intruded the crust and the Kunyushan granitic complex (Guo et al., 2005; Li et al., 2018; Tang, 2008; Zhang et al., 2010) and, at the same time, arc-like mafic magmas were formed (Guo et al., 2005; Hu, 2006). Thirdly, from 110 to 100 Ma, a back-arc extensional regime developed due to subduction of the Paleo-Pacific Plate. the metasomatised and previously fertilised lithospheric mantle underwent devolatilisation due to asthenospheric upwelling, which released auriferous H2O–CO2 fluids with positive δ34S values (Botcharnikov et al., 2011; Zhai and Santosh, 2013). The ore-forming fluids from the mantle migrated upward through deep NNE–SSW-trending faults, and reacted with and metasomatised surrounding crustal rocks (i.e., the Jiaodong and Jingshan groups, and Kunyushan granitic complex). significant volumes of crustal fluid migrated upwards to shallow levels. Meteoric waters progressively contributed to the mineralisation process, which finally formed the Muping–Rushan gold belt.
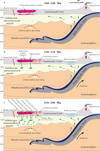 |
Fig. 10 Genetic model of the Muping–Rushan gold belt (modified from (Deng et al., 2020a; Deng et al., 2020b; Lei et al., 2018)). (a) Late Jurassic (160∼140 Ma) magmatic activity, Kunyushan granitic complex emplacement; (b) Early Cretaceous (120∼110 Ma) magmatic activity, emplacement of the Sanfoshan granite and arc-related mafic dyke; (c) Subsequently (110∼100 Ma), the gold mineralization process of Muping–Rushan gold belt. |
7 Conclusions
(1) Elemental mapping of pyrite and pyrrhotite in typical gold deposits in the Muping–Rushan gold belt showed that silver and gold are mainly hosted in infilled cracks in Py1 or occur at the rims of stage II and III sulphides. The arsenic contents are higher in the rims and cracks of Py1 and around Py2, and are positively correlated with gold contents. Arsenic displays zoning in some pyrite grains.
(2) The sulphides have δ34S = 5.8‰–10.1‰, suggesting that sulphur in the mineralization stages II and III was derived from the Jiaodong and Jingshan Groups and the Kunyushan granitic complex. The lead isotope data are suggest derivation from lower crustal and orogenic sources.
(3) 3He/4He, 40Ar/36Ar, and 40Ar*/4He ratios of the gold deposits are 0.01–5.06 Ra, 389.8–4674.7, and 0.03–2.78, respectively, indicating the ore-forming fluids in the Muping–Rushan gold belt were mainly derived from the crust, but with some involvement of mantle-derived fluids.
Acknowledgments
This study was supported by the National Pre-study Project of Hebei GEO University (KY2024QN25), PhD Research Start-up Foundation of Hebei GEO University (BQ2024006), National Key R&D Program of China (2016YFC0600107, 2018YFC0603805-1), Projects funded by the China Geological Survey (DD20190379-31, 200110200038, DD20190155 and DD20160044), Hebei Provincial Natural Science Foundation (D2022403027). The authors especially thank Hu Guo from Tianjin Geological Survey Center, China Geological Survey for assistance with electron microprobe elemental mapping.
Supplementary Material
Fig. 1. Element mapping shows the texture of the pyrites and pyrrhotites from Muping-Rushan gold belt. BEI=Backscattered electron imaging. Py=pyrite, Po= pyrrhotite.
Table 1. Metallogenetic geologic characteristics of typical ore deposits.
Table 2. Samples description and location presented in this study
Table 3. In situ sulfur isotope analyses in Muping-Rushan gold belt.
Table 4. Lead isotope composition for Muping-Rushan gold belt, Kunyushan granitic complex and Jiaodong group.
Table 5. Helium and argon data for fluids extracted from Muping-Rushan gold belt.
Access Supplementary MaterialReferences
- An J.T., Yu D.B., Shen K. 1988. The study of gold ore conditions in Muping-Rushan area, Shandong. Beijing: Geological Publishing House (in Chinese). [Google Scholar]
- Andrews J.N. 1985. The isotopic composition of radiogenic helium and its use to study groundwater movement in confined aquifers. Chem. Geol. 49 (1-3): 339–351. https://doi.org/10.1016/0009-2541(85)90166-4. [CrossRef] [Google Scholar]
- Ballentine C.J., Burnard P.G. 2002. Production, release and transport of noble gases in the continental crust. Rev. Mineral. Geochem. 47 (1): 481–538. https://doi.org/10.2138/rmg.2002.47.12. [CrossRef] [Google Scholar]
- Botcharnikov R.E., Linnen R.L., Wilke M., Holtz F., Jugo P.J., Berndt J. 2011. High gold concentrations in sulphide-bearing magma under oxidising conditions. Nat. Geosci. 4 (2): 112–115. https://doi.org/10.1038/ngeo1042. [CrossRef] [Google Scholar]
- Burnard P.G., Hu R.Z., Turner G., Bi X.W. 1999. Mantle, crustal and atmospheric noble gases in Ailaoshan gold deposits, Yunnan Province, China. Geochim. Cosmochim. Acta 63 (10): 1595–1604. https://doi.org/10.1016/S0016-7037(99)00108-8. [CrossRef] [Google Scholar]
- Burnard P.G., Polya D.A. 2004. Importance of mantle-derived fluids during granite-associated hydrothermal circulation: He and Ar isotopes of ore minerals from Panasqueira. Geochim. Cosmochim. Acta 68 (7): 1607–1615. https://doi.org/10.1016/j.gca.2003.10.008. [CrossRef] [Google Scholar]
- Chen B.H. 2017. Gold mineralization geochemistry in Muping-Rushan gold belt, Jiaodong Peninsula, China. Beijing: China University of Geosciences (Beijing) (in Chinese with English abstract). [Google Scholar]
- Chen G.Y. 1989. Genetic mineralogy of gold deposits in Jiaodong region with emphasis on gold prospecting. Chongqing: Chongqing Publishing House (in Chinese). [Google Scholar]
- Chen H.Y. 2010. Genetic mineralogy and deep prospects of Jinqingding gold deposit in Rushan, East Shandong Province. Beijing: China University of Geosciences (Beijing) (in Chinese with English abstract). [Google Scholar]
- Cui J.C. 2012. Genetic mineralogy in gold ore-forming belt of Muping-Rushan in Jiaodong. Beijing: China University of Geosciences (Beijing) (in Chinese with English abstract). [Google Scholar]
- Dang Z.C., Li J.J., Fu C., Tian J.P., He J.T., Sun Z.B., Tang W.L., Zhang P.P. 2022. Petrogenesis and geodynamic setting of the Late Jurassic Queshan adakitic granite, Jiaodong Peninsula, southeastern North China Craton: Zircon U-Pb geochronological, geochemical, and Lu-Hf isotopic evidence. Geol. J. 57 (5): 1891–1911. https://doi.org/10.1002/gj.4386. [Google Scholar]
- Deng J., Liu X.F., Wang Q.F., Pan R.G. 2015. Origin of the Jiaodong-type Xinli gold deposit, Jiaodong Peninsula, China: Constraints from fluid inclusion and C-D-O-S-Sr isotope compositions. Ore Geol. Rev. 65: 674–686. https://doi.org/10.1016/j.oregeorev.2014.04.018. [CrossRef] [Google Scholar]
- Deng J., Qiu K.F., Wang Q.F., Goldfarb R., Yang L.Q., Zi J.W., Geng J.Z., Ma Y. 2020b. In situ dating of hydrothermal monazite and implications for the geodynamic controls on ore formation in the Jiaodong gold province, eastern China. Econ. Geol. 115 (3): 671–685. https://doi.org/10.5382/econgeo.4711. [Google Scholar]
- Deng J., Wang C.M., Bagas L., Santosh M., Yao E. 2018. Crustal architecture and metallogenesis in the south-eastern North China Craton. Earth-Sci. Rev. 182: 251–272. https://doi.org/10.1016/j.earscirev.2018.05.001. [CrossRef] [Google Scholar]
- Deng J., Wang Q.F., Liu X.F., Zhang L., Yang L.Q., Yang L., Qiu K.F., Guo L.N., Liang Y.Y., Ma Y. 2022. The formation of the Jiaodong gold province. Acta Geol. Sin. − Engl. Ed. 96 (6): 1801–1820. https://doi.org/10.1111/1755-6724.15026. [CrossRef] [Google Scholar]
- Deng J., Wang Q.F., Santosh M., Liu X.F., Liang Y.Y., Yang L.Q., Zhao R., Yang L. 2020a. Remobilisation of metasomatised mantle lithosphere: A new model for the Jiaodong gold province, eastern China. Miner. Deposita 55 (2): 257–274. https://doi.org/10.1007/s00126-019-00925-0. [CrossRef] [Google Scholar]
- Deng J., Wang Q.F., Zhang L., Xue S.C., Liu X.F., Yang L., Yang L.Q., Qiu K.F., Liang Y.Y. 2023. Metallogenetic model of Jiaodong-type gold deposits, eastern China. Sci. China Earth Sci. 66 (10): 2287–2310. https://doi.org/10.1007/s11430-022-1136-4. [CrossRef] [Google Scholar]
- Department of Geochemistry, Wuhan College of Geology. 1979. Geochemistry. Beijing: Geological Publishing House (in Chinese). [Google Scholar]
- Ding Q.F., Jiang S.Y., Sun F.Y., Qian Y., Wang G. 2013. Origin of the Dachang gold deposit, NW China: Constraints from H, O, S, and Pb isotope data. Int. Geol. Rev. 55 (15): 1885–1901. https://doi.org/10.1080/00206814.2013.804687. [CrossRef] [Google Scholar]
- Dunai T.J., Baur H. 1995. Helium, neon, and argon systematics of the European subcontinental mantle: Implications for its geochemical evolution. Geochim. Cosmochim. Acta 59 (13): 2767–2783. https://doi.org/10.1016/0016-7037(95)00172-V. [CrossRef] [Google Scholar]
- Fan H.R., Feng K., Li X.H., Hu F.F., Yang K.F. 2016. Mesozoic gold mineralisation in the Jiaodong and Korean peninsulas. Acta Petrol. Sin. 32 (10): 3225––3238 (in Chinese with English abstract). [Google Scholar]
- Fontes J.C., Andrews J.N., Walgenwitz F. 1991. Evaluation of natural in situ production of 36Ar via 36Cl: Geochemical and geochronological implications. C. R. Acad. Sci. Paris, Sér. II 313 (6): 649––654. [Google Scholar]
- Gebre-Mariam M., Hagemann S.G., Groves D.I. 1995. A classification scheme for epigenetic Archaean lode-gold deposits. Miner. Deposita 30 (5): 408–410. https://doi.org/10.1007/BF00202283. [CrossRef] [Google Scholar]
- Goldfarb R.J., Groves D.I. 2015. Orogenic gold: Common or evolving fluid and metal sources through time. Lithos 233: 2–26. https://doi.org/10.1016/j.lithos.2015.07.011. [CrossRef] [Google Scholar]
- Goldfarb R.J., Santosh M. 2014. The dilemma of the Jiaodong gold deposits: Are they unique? Geosci. Front. 5 (2): 139–153. https://doi.org/10.1016/j.gsf.2013.11.001. [CrossRef] [Google Scholar]
- Goldfarb R.J., Groves D.I., Gardoll S. 2001. Orogenic gold and geologic time: A global synthesis. Ore Geol. Rev. 18 (1): 1–75. https://doi.org/10.1016/S0169-1368(01)00016-6. [CrossRef] [Google Scholar]
- Goldfarb R., Baker T., Dubé B., Groves D., Hart C., Gosselin P. 2005. Distribution, character, and genesis of gold deposits in metamorphic terranes. Econ. Geol. 100th Anniv.: 407––450. [Google Scholar]
- Goodwin N.R.J., Burgess R., Craw D., Teagle D.A.H., Ballentine C.J. 2017. Noble gases fingerprint a metasedimentary fluid source in the Macraes orogenic gold deposit, New Zealand. Miner. Deposita 52 (2): 197–209. https://doi.org/10.1007/s00126-016-0648-x. [CrossRef] [Google Scholar]
- Groves D.I., Goldfarb R.J., Knox-Robinson C.M., Ojala J., Gardoll S., Yun G.Y., Holyland P. 2000. Late-kinematic timing of orogenic gold deposits and significance for computer-based exploration techniques with emphasis on the Yilgarn Block, Western Australia. Ore Geol. Rev. 17 (1): 1–38. https://doi.org/10.1016/S0169-1368(00)00002-0. [CrossRef] [Google Scholar]
- Groves D.I., Phillips G.N., Ho S.E., Houstoun S.M., Standing C.A. 1987. Craton-scale distribution of Archaean greenstone gold deposits; predictive capacity of the metamorphic model. Econ. Geol. 82 (8): 2045–2058. https://doi.org/10.2113/gsecongeo.82.8.2045. [CrossRef] [Google Scholar]
- Groves D.I., Santosh M., Deng J., Wang Q.F., Yang L.Q., Zhang L. 2020. A holistic model for the origin of orogenic gold deposits and its implications for exploration. Miner. Deposita 55 (2): 275–292. https://doi.org/10.1007/s00126-019-00877-5. [CrossRef] [Google Scholar]
- Groves D.I., Zhang L., Santosh M. 2019. Subduction, mantle metasomatism, and gold: A dynamic and genetic conjunction. GSA Bull. 132 (7-8): 1419–1426. https://doi.org/10.1130/B35379.1. [Google Scholar]
- Guo J.H., Chen F.K., Zhang X.M., Siebel W., Zhai M.G. 2005. Evolution of syn- to post-collisional magmatism from north Sulu UHP belt, eastern China: Zircon U-Pb geochronology. Acta Petrol. Sin. 21 (4): 1281–1301 (in Chinese with English abstract). https://doi.org/10.3969/j.issn.1000-0569.2005.04.025. [Google Scholar]
- Guo P., Santosh M., Li S. 2013. Geodynamics of gold metallogeny in the Shandong Province, NE China: An integrated geological, geophysical and geochemical perspective. Gondwana Res. 24 (3): 1172–1202. https://doi.org/10.1016/j.gr.2013.02.004. [CrossRef] [Google Scholar]
- He J.T., Li J.J., Fu C., Zhou H.Y., Li X.Z., Dang Z.C., Tian J.P., Tang W.L. 2021. Petrogenesis and tectonic implication of the Late Jurassic Kunyushan granitic complex in the Jiaodong Peninsula, eastern China. Geol. J. 56 (6): 3275–3300. https://doi.org/10.1002/gj.4101. [CrossRef] [Google Scholar]
- Hu F.F. 2006. Magmatism, ore fluid evolution and gold mineralisation of the Kunyushan area in the Jiaodong Peninsula during the Mesozoic tectonic regime inversion in eastern China. Beijing: Graduate University of the Chinese Academy of Sciences (in Chinese with English abstract). [Google Scholar]
- Hu F.F., Fan H.R., Yang J.H., Wan Y.S., Liu D.Y., Zhai M.G., Jin C.W. 2004. Metallogenic age of Rushan gold-bearing quartz vein gold deposit in Jiaodong: Hydrothermal zircon SHRIM PU–Pb dating. Chin. Sci. Bull. 49 (12): 1191––1198 (in Chinese with English abstract). https://doi.org/10.1360/csb2004-49-12-1191. [CrossRef] [Google Scholar]
- Hu G.X., Rumble D., Wang P.L. 2003. An ultraviolet laser microprobe for the in situ analysis of multisulphur isotopes and its use in measuring Archaean sulphur isotope mass-independent anomalies. Geochim. Cosmochim. Acta 67 (17): 3101–3118. https://doi.org/10.1016/S0016-7037(02)00929-8. [CrossRef] [Google Scholar]
- Hu R.Z., Bi X.W., Turner G., Burnard P.G. 1997. He-Ar isotopic systematics of fluid inclusions in pyrite from Machangqing copper deposit, Yunnan, China. Sci. China Ser. D 27 (6): 503––508 (in Chinese with English abstract). [Google Scholar]
- Isozaki Y. 1997. Jurassic accretion tectonics of Japan. Isl. Arc 6 (1): 25–51. https://doi.org/10.1111/j.1440-1738.1997.tb00039.x. [CrossRef] [Google Scholar]
- Kerrich R., Goldfarb R., Richards J. 2005. Metallogenic provinces in an evolving geodynamic framework. Econ. Geol. 100th Anniv.: 1097–1136. https://doi.org/10.5382/AV100.33. [Google Scholar]
- Lei J.S., Zhao D.P., Xu Y.G., Du Z.Z., Fan Q.C., Mi Q., Du M.F., Lu M.W. 2018. Is there a gap in the stagnant Pacific slab in the mantle transition zone under the Changbaishan volcano? Acta Petrol. Sin. 34 (1): 13––22 (in Chinese with English abstract). [Google Scholar]
- Li H.K., Yang Y.B., Geng K., Qi C.Y., Zhang C.F., Liang T.T. 2013. Subdivision of the Bohai landmass from the North China Block and its implications. Geol. Surv. Res. 36 (3): 173––180 (in Chinese with English abstract). [Google Scholar]
- Li J.W., Paulo V., Zhou M.F., Zhao X.F., Ma C.Q. 2006. Geochronology of the Pengjiakuang and Rushan gold deposits, eastern Jiaodong gold province, northeastern China: Implications for regional mineralisation and geodynamic setting. Econ. Geol. 101 (5): 1023–1038. https://doi.org/10.2113/gsecongeo.101.5.1023. [CrossRef] [Google Scholar]
- Li S.R., Santosh M. 2014. Metallogeny and craton destruction: Records from the North China Craton. Ore Geol. Rev. 56: 376–414. https://doi.org/10.1016/j.oregeorev.2013.03.002. [CrossRef] [Google Scholar]
- Li X.F. 2011. The ore genesis and prospecting direction of Jinqingding gold deposit of the Muping-Rushan gold ore belt in eastern Shandong. Xi’an: Chang’an University (in Chinese with English abstract). [Google Scholar]
- Li Y.H., Li J.C., Song H.B., Yue G.L. 2002. Helium isotope measurement of fluid inclusions and its geological applications. Miner. Deposits 21(Z6): 982––985 (in Chinese with English abstract). [Google Scholar]
- Li Z.D., Yu X.F., Wang Q.M., Du Z.Z., Cao Q., Shi M.Y., Wang R. 2018. Petrogenesis of Sanfoshan granite, Jiaodong: Diagenetic physical and chemical conditions, zircon U-Pb geochronology and Sr-Nd isotope constraints. Acta Petrol. Sin. 34 (2): 447––468 (in Chinese with English abstract). [Google Scholar]
- Li Z.L., Yang M.Z. 1993. Geology and geochemistry of gold deposits in Jiaodong. Tianjin: Tianjin Science and Technology Press (in Chinese). [Google Scholar]
- Li Z.P. 1992. The genesis of the Rushan gold deposit in East Shandong. Miner. Deposits 11 (2): 165––178 (in Chinese with English abstract). [Google Scholar]
- Liu G.Q., Zhao K.D., Jiang S.Y., Chen W. 2018. In-situ sulphur isotope and trace element analysis of pyrite from the Xiwang uranium ore deposit in South China: Implication for ore genesis. J. Geochem. Explor. 195: 49–65. https://doi.org/10.1016/j.gexplo.2018.07.012. [Google Scholar]
- Mamyrin B.A., Tolstikhin I.N. 1984. Helium isotopes in nature. Amsterdam: Elsevier Science. [Google Scholar]
- Mamyrin B.A., Anufriev G., Kamenskii I.L., Tolstikhin I. 1970. The determination of atmospheric helium isotope composition. Geokhimiya 6 (6): 721––730. [Google Scholar]
- Mao J.W., Wang Y.T., Li H.M., Pirajno F., Zhang C.Q., Wang R.T. 2008. The relationship of mantle-derived fluids to gold metallogenesis in the Jiaodong Peninsula: Evidence from D-O-C-S isotope systematics. Ore Geol. Rev. 33 (3): 361–381. https://doi.org/10.1016/j.oregeorev.2007.01.003. [CrossRef] [Google Scholar]
- Mao J.W., Hua R.M., Li X.B. 1999. A preliminary study of large-scale metallogenesis and large clusters of mineral deposits. Miner. Deposits 18 (4): 291––299 (in Chinese with English abstract). [Google Scholar]
- Maruyama S., Isozaki Y., Kimura G., Terabayashi M. 1997. Palaeogeographic maps of the Japanese Islands: Plate tectonic synthesis from 750 Ma to the present. Isl. Arc 6 (1): 121–142. https://doi.org/10.1111/j.1440-1738.1997.tb00043.x. [CrossRef] [Google Scholar]
- Ohmoto H., Goldhaber B. 1997. Geochemistry of hydrothermal ore deposit. In: Baenes H.L., ed. Geochemistry of hydrothermal ore deposits, 3rd ed. New York: John Wiley and Sons, pp. 517–600. [Google Scholar]
- Patterson D.B., Honda M., McDougall I. 1994. Noble gases in mafic phenocrysts and xenoliths from New Zealand. Geochim. Cosmochim. Acta 58 (20): 4411–4427. https://doi.org/10.1016/0016-7037(94)90344-1. [CrossRef] [Google Scholar]
- Phillips G.N., Powell R. 2010. Formation of gold deposits: A metamorphic devolatilisation model. J. Metamorph. Geol. 28 (6): 689–718. https://doi.org/10.1111/j.1525-1314.2010.00887.x. [CrossRef] [Google Scholar]
- Porcelli D.R., O’Nions R.K., Galer S.J.G., Cohen A.S., Mattey D.P. 1992. Isotopic relationships of volatile and lithophile trace elements in continental ultramafic xenoliths. Contrib. Mineral. Petrol. 110 (4): 528–538. https://doi.org/10.1007/BF00344086. [CrossRef] [Google Scholar]
- Quan Y.K., Yang D.B., Mu M.S., Hao L.R., Yang H.T., Wang A.Q., Xu W.L. 2020. Tectonic evolution of the northeastern North China Craton: Constraints from geochronology and Sr-Nd-Hf-O isotopic data from Late Triassic intrusive rocks on Liaodong Peninsula, NE China. Lithos 362-363: 105489. https://doi.org/10.1016/j.lithos.2020.105489. [CrossRef] [Google Scholar]
- Reid M.R., Graham D.W. 1996. Resolving lithospheric and sub-lithospheric contributions to helium isotope variations in basalts from the southwestern US. Earth Planet. Sci. Lett. 144 (1-2): 213–222. https://doi.org/10.1016/0012-821X(96)00166-5. [CrossRef] [Google Scholar]
- Sai S.X., Deng J., Qiu K.F., Miggins D.P., Zhang L 2020. Textures of auriferous quartz-sulphide veins and 40Ar/39Ar geochronology of the Rushan gold deposit: Implications for processes of ore-fluid infiltration in the eastern Jiaodong gold province, China. Ore Geol. Rev. 117: 103254. https://doi.org/10.1016/j.oregeorev.2019.103254. [CrossRef] [Google Scholar]
- Song M.C. 2012. Shandong geology and mineral atlas. Jinan: Shandong Map Publishing House (in Chinese). [Google Scholar]
- Song M.C., Ai X.S., Yu X.F., Tian J.X., Li H.K., Ni Z.P., Jiao X.M., Song Y.X. 2015. Types and temporal-spatial distribution of mineral resources in Shandong Province. Miner. Deposits 34 (6): 1237–1254 (in Chinese with English abstract). https://doi.org/10.16111/j.0258-7106.2015.06.011. [Google Scholar]
- Song M.C., Hu W.X., Li J., Ding Z.J., Song Y.X., Peng Y.H. 2023. Metallogenic series of Jiaodong-type gold deposits and its prospecting cases. Acta Geosci. Sin. 44 (5): 781–796 (in Chinese with English abstract). https://doi.org/10.3975/cagsb.2022.110201. [Google Scholar]
- Stacey J.S., Kramers J.D. 1975. Approximation of terrestrial lead isotope evolution by a two-stage model. Earth Planet. Sci. Lett. 26 (2): 207–221. https://doi.org/10.1016/0012-821X(75)90088-6. [CrossRef] [Google Scholar]
- Tang H.Y. 2008. Zircon U-Pb ages, geochemistry of the Rushan gabbro-diorites and their mafic xenoliths from the northern Sulu orogen, Shandong Province, eastern China. Wuhan: China University of Geosciences (Wuhan) (in Chinese with English abstract). [Google Scholar]
- Tang J., Zheng Y.F., Wu Y.B., Gong B., Zha X.P., Liu X.M. 2008. Zircon U-Pb age and geochemical constraints on the tectonic affinity of the Jiaodong terrane in the Sulu orogen, China. Precambrian Res. 161 (3-4): 389–418. https://doi.org/10.1016/j.precamres.2007.09.008. [CrossRef] [Google Scholar]
- Wang Q.F., Groves D.I., Deng J., Li H.J., Yang L., Dong C.Y. 2020. Evolution of the Miocene Ailaoshan orogenic gold deposits, southeastern Tibet, during a complex tectonic history of lithosphere-crust interaction. Miner. Deposita 55 (6): 1085–1104. https://doi.org/10.1007/s00126-019-00922-3. [CrossRef] [Google Scholar]
- Wang Y.W. 1988. Lead isotope composition of gold deposit, north-western Jiaodong, Shandong, and its geological significance. J. Changchun Univ. Earth Sci. 18 (3): 277––286 (in Chinese with English abstract). [Google Scholar]
- Wang Y.W., Zhu F.S., Gong R.T. 2002. Tectonic isotope geochemistry―Further study on sulphur isotope of Jiaodong gold concentration area. Gold 23 (4): 1––16 (in Chinese with English abstract). [Google Scholar]
- Wu F.Y., Zhao G.C., Wilde S.A., Sun D.Y. 2005. Nd isotopic constraints on crustal formation in the North China Craton. J. Asian Earth Sci. 24 (5): 523–545. https://doi.org/10.1016/j.jseaes.2003.10.011. [CrossRef] [Google Scholar]
- Wu K.X., Hu R.Z., Bi X.W., Peng J.T., Tang Q.L. 2002. Ore lead isotopes as a tracer for ore-forming material sources: A review. Geol. Geochem. 30 (3): 73––81 (in Chinese with English abstract). [Google Scholar]
- Xu G.P., Zhai J.P., Hu K. 1999. The roles of fluid in the formation of ore deposits and the main study methods. Contrib. Geol. Miner. Resour. Res. 14 (4): 1––7 (in Chinese with English abstract)). [Google Scholar]
- Xu J.F. 1986. The age and petrological characteristics of the Kunyushan rock mass. Shandong Geol. Intell. (2): 24––37 (in Chinese with English abstract). [Google Scholar]
- Xue J.L., Li S.R., Sun W.Y., Zhang Y.Q., Zhang X., Liu C.L. 2013. Helium and argon isotopic composition in fluid inclusions and the source of ore-forming materials of Denggezhuang gold deposit in Jiaodong Peninsula. J. Jilin Univ. (Earth Sci. Ed.) 43 (2): 400––414 (in Chinese with English abstract). [Google Scholar]
- Yang J.H., Zhou X.H. 2001. Rb-Sr, Sm-Nd, and Pb isotope systematics of pyrite: Implications for the age and genesis of lode gold deposits. Geology 29 (8): 711–714. https://doi.org/10.1130/0091-7613(2001)029<0711:RSSNAP>2.0.CO;2. [CrossRef] [Google Scholar]
- Yang J.H., Chung S.L., Wilde S.A., Wu F.Y., Chu M.F., Lo C.H., Fan H.R. 2005. Petrogenesis of post-orogenic syenites in the Sulu orogenic belt, East China: Geochronological, geochemical and Nd-Sr isotopic evidence. Chem. Geol. 214 (1): 99–125. https://doi.org/10.1016/j.chemgeo.2004.08.053.ang. [CrossRef] [Google Scholar]
- Yang J.H. 2000. Age and metallogenic dynamics of gold mineralisation in Jiaodong Peninsula, eastern China − Constraints on the interaction of mantle/crust and metallogenesis/lithospheric evolution. Beijing: Graduate University of the Chinese Academy of Sciences (in Chinese with English abstract). [Google Scholar]
- Yang J.H., Wu F.Y., Shao J.A., Xie L.W., Liu X.M. 2006. In-situ U-Pb dating and Hf isotopic analyses of zircons from volcanic rocks of the Houcheng and Zhangjiakou formations in the Zhang-Xuan area, Northeast China. Earth Sci. − J. China Univ. Geosci. 31 (1): 71––80 (in Chinese with English abstract). [Google Scholar]
- Yang L.Q., Deng J., Goldfarb R.J., Zhang J., Gao B.F., Wang Z.L. 2014. 40Ar/39Ar geochronological constraints on the formation of the Dayingezhuang gold deposit: New implications for timing and duration of hydrothermal activity in the Jiaodong gold province, China. Gondwana Res. 25: 1469–1483. http://dx.doi.org/10.1016/jgr.2013.07.001 [CrossRef] [Google Scholar]
- Yang L.Q., Deng J., Wang Z.L., Guo L.N., Li R.H., Groves D.I., Danyushevsky L.V., Zhang C., Zheng X.L., Zhao H. 2016. Relationships between gold and pyrite at the Xincheng gold deposit, Jiaodong Peninsula, China: Implications for gold source and deposition in a brittle epizonal environment. Econ. Geol. 111 (1): 105–126. https://doi.org/10.2113/econgeo.111.1.105. [CrossRef] [Google Scholar]
- Yang L.Q., Deng J., Song M.C., Yu X.F., Wang Z.L., Li R.H., Wang S.R. 2019. Structure control on formation and localisation of giant deposits: An example of Jiaodong gold deposits in China. Geotecton. Metallog. 43 (3): 431–446 (in Chinese with English abstract). https://doi.org/10.16539/j.ddgzyckx.2019.03.005. [Google Scholar]
- Yang L.Q., Deng J., Wang Z.L., Zhang L., Guo L.N., Song M.C., Zheng X.L. 2014. Mesozoic gold metallogenic system of the Jiaodong gold province, eastern China. Acta Petrol. Sin. 30 (9): 2447––2467 (in Chinese with English abstract). [Google Scholar]
- Yang M.Z., Lv G.X. 1996. Geology and geochemistry of gold deposits occurred in Jiaodong greenstone terrain. Beijing: Geological Publishing House (in Chinese). [Google Scholar]
- Yang Z.F., Xu J.K., Zhao L.S., Shen Y.L., Wu Y.B. 1998. Regional crust evolution and geochemistry of gold mineralisation in Jiaodong. Beijing: Geological Publishing House (in Chinese). [Google Scholar]
- Zartman R.E., Doe B.R. 1981. Plumbotectonics—the model. Tectonophysics 75 (1-2): 135–162. https://doi.org/10.1016/0040-1951(81)90213-4. [CrossRef] [Google Scholar]
- Zhai M.G., Santosh M. 2013. Metallogeny of the North China Craton: Link with secular changes in the evolving Earth. Gondwana Res. 24 (1): 275–297. https://doi.org/10.1016/j.gr.2013.02.007. [CrossRef] [Google Scholar]
- Zhai M.G., Fan H.R., Yang J.H., Miao L.C. 2004. Large-scale cluster in East Shandong: Anorogenic metallogenesis. Earth Sci. Front. 11 (1): 85––98 (in Chinese with English abstract). [Google Scholar]
- Zhang D.H., Zhao L.S., Zhang B.R., Chen Y.L., Mao S.D., Yang Z.F., Hou Q.Y., Yuan G.L. 2013. Geochemistry. Beijing: Geological Publishing House (in Chinese). [Google Scholar]
- Zhang J., Zhao Z., Zheng Y., Dai M. 2010. Post-collisional magmatism: Geochemical constraints on the petrogenesis of Mesozoic granitoids in the Sulu orogen, China. Lithos 119 (3-4): 512–536. https://doi.org/10.1016/j.lithos.2010.08.005. [CrossRef] [Google Scholar]
- Zhang L.C., Shen Y.C., Li H.M., Zeng Q.D., Li G.M., Liu T.B. 2002. Helium and argon isotopic compositions of fluid inclusions and tracing to the source of ore-forming fluids for Jiaodong gold deposits. Acta Petrol. Sin. 18 (4): 559––565 (in Chinese with English abstract). [Google Scholar]
- Zhang L.G. 1988. Lead isotopic compositions of feldspars and ores and their geologic significance. Miner. Deposits 7 (2): 55––64 (in Chinese with English abstract). [Google Scholar]
- Zhang Y.Q., Li J.L., Zhang T., Dong S.W., Yuan J.Y. 2008. Cretaceous to Paleocene tectono-sedimentary evolution of the Jiaolai Basin and the contiguous areas of the Shandong Peninsula (North China) and its geodynamic implications. Acta Geol. Sin. 82 (9): 1229–1257 (in Chinese with English abstract). https://doi.org/10.3321/j.issn:0001-5717.2008.09.007. [CrossRef] [Google Scholar]
- Zhang Y.Q., Li S.R., Chen H.Y., Zhang X.B., Zhou Q.F., Cui J.C., Song Y.B., Guo J. 2012. Trace element and He-Ar isotopic evidence of pyrite for the source of ore-forming fluids in the Jinqingding gold deposit, eastern Shandong Province. Geol. China 39 (1): 195––204 (in Chinese with English abstract). [Google Scholar]
- Zhang Z.R., Chen S.Z. 1999. Superlarge gold deposit exploration perspective in Jiaolai Basin of Jiaodong gold metallogenetic domain. Geochimica 28 (3): 203––212 (in Chinese with English abstract). [Google Scholar]
- Zhao H.S., Wang Q.F., Groves D.I., Deng J. 2019. A rare Phanerozoic amphibolite-hosted gold deposit at Danba, Yangtze Craton, China: Significance to fluid and metal sources for orogenic gold systems. Miner. Deposita 54 (1): 133–152. https://doi.org/10.1007/s00126-018-0845-x. [CrossRef] [Google Scholar]
- Zhao K.D., Jiang S.Y., Ni P., Ling H.F., Jiang Y.H. 2007. Sulphur, lead and helium isotopic compositions of sulphide minerals from the Dachang Sn-polymetallic ore district in South China: Implication for ore genesis. Miner. Petrol. 89 (3): 251–273. https://doi.org/10.1007/s00710-006-0148-2. [CrossRef] [Google Scholar]
- Zhao W.J., Zhao X., Shi D.N., Liu K., Jiang W., Wu Z.H., Xiong J.Y., Zheng Y.K. 2010. Progress in the study of deep profiles of Tibet and Himalayas (indepth). Acta Geol. Sin. − Engl. Ed. 78 (4): 931–939. https://doi.org/10.1111/j.1755-6724.2004.tb00215.x. [Google Scholar]
- Zheng Y.F. 2023. Plate tectonics in the twenty-first century. Sci. China Earth Sci. 66 (1): 1–40. https://doi.org/10.1007/s11430-022-1011-9. [CrossRef] [Google Scholar]
- Zheng Y.F., Wu F.Y. 2018. The timing of continental collision between India and Asia. Sci. Bull. 63 (24): 1649–1654. https://doi.org/10.1016/j.scib.2018.11.022. [CrossRef] [Google Scholar]
- Zheng Y.F., Xiao W.J., Zhao G.C. 2013. Introduction to tectonics of China. Gondwana Res. 23 (4): 1189–1206. https://doi.org/10.1016/j.gr.2012.10.001. [CrossRef] [Google Scholar]
- Zheng Y.F., Zhao Z.F., Chen R.X. 2019. Ultrahigh-pressure metamorphic rocks in the Dabie-Sulu orogenic belt: Compositional inheritance and metamorphic modification. Geol. Soc. Lond. Spec. Publ. 474: 89–132. https://doi.org/10.1144/SP474.9. [CrossRef] [Google Scholar]
- Zhou Q.F. 2010. Genetic mineralogy and deep prospects of the Yinggezhuang gold deposit in Rushan County, Jiaodong. Beijing: China University of Geosciences (Beijing) (in Chinese with English abstract). [Google Scholar]
- Zhou T., Goldfarb R.J., Phillips N.G. 2002. Tectonics and distribution of gold deposits in China—An overview. Miner. Deposita 37 (3): 249–282. https://doi.org/10.1007/s00126-001-0237-4. [CrossRef] [Google Scholar]
- Zhu B.Q., Li X.H., Dai T.M. 1998. The theory and application of the isotopic systematic in geoscience concurrent— Discussion of the continental crust and mantle evolvement in China. Beijing Science Publishing House(in Chinese). [Google Scholar]
- Zhu G., Wang W., Gu C.C., Zhang S., Liu C. 2016. Late Mesozoic evolution history of the Tan-Lu Fault Zone and its indication to destruction processes of the North China Craton. Acta Petrol. Sin. 32 (4): 935––949 (in Chinese with English abstract). [Google Scholar]
- Zhu R.X., Xu Y.G. 2019. The subduction of the west Pacific plate and the destruction of the North China Craton. Sci. China Earth Sci. 62: 1340–1350. https://doi.org/10.1007/s11430-018-9356-y. [CrossRef] [Google Scholar]
- Zhu Z.Y., Jiang S.Y., Ciobanu C.L., Yang T., Cook N.J. 2017. Sulphur isotope fractionation in pyrite during laser ablation: Implications for laser ablation multiple collector inductively coupled plasma mass spectrometry mapping. Chem. Geol. 450 (5): 223–234. https://doi.org/10.1016/j.chemgeo.2016.12.037. [CrossRef] [Google Scholar]
Cite this article as: He J-T, Li J-J, Liu L-L, Tian J-P, Man R-H, Shi G-Y, Wang C-G, Feng Z. 2025. Geological and S–Pb–He–Ar isotope constraints on the origin of the Muping–Rushan gold belt, Jiaodong Peninsula, eastern China, BSGF - Earth Sciences Bulletin 196: 9. https://doi.org/10.1051/bsgf/2025007.
All Figures
|
Fig. 1 Regional distribution of Muping–Rushan gold belt and simplified geological map of the Jiaodong area. (a) Tectonic subdivision of the Shandong Peninsula (modified after (He et al., 2021; Tang et al., 2008)); (b) Simplified geological map of the Jiaodong area (modified after (Fan et al., 2016; Song, 2012)). KYS-Kunyushan granitic complex, SFS-Sanfoshan granite, DGS-Duogushan granodiorite, WD-Wendeng granite, WDS-Weideshan granite, JZS-Jiazishan complex. |
| In the text | |
|
Fig. 2 Geological sketch map of the Muping–Rushan gold belt. F1 Qinghushan–Tangjiagou Fault, F2 Jinniushan Fault, F3 Chahe–Sanjia Fault, F4 Jiangjunshi–Quhezhuang Fault, F5 Majiazhuang–Gekou Fault. |
| In the text | |
|
Fig. 3 Paragenetic sequence of hydrothermal minerals in the Muping–Rushan gold belt. Minerals’ relative abundance is represented by the thickness of solid lines (thick = abundant, thin = less abundant, dashed = least abundant). |
| In the text | |
|
Fig. 4 Representative photographs showing mineral paragenesis of the ore from the Muping–Rushan gold belt. |
| In the text | |
|
Fig. 5 Representative photomicrographs of samples from the Tangjiagou and Dengezhuang gold deposits. (a) Assemblage of pyrite (Py1+Py2) (RPPL); (b) Pyrrhotite (Po) was cut by pyrite (Py3) (RPPL); (c) Sphalerite (Sp) contained pyrite (Py1) and chalcopyrite (Ccp) blebs were distributed along the pyrite (Py1) boundaries and fractures (RPPL); (d) Quartz (Qtz1) was cut by an aggregate of quartz (Qtz2) and calcite (Cal) filling fractures (TXPL); (e) Assemblage of pyrite (Py1+Py4) (RPPL); (f) Calcite (Cal) and quartz (Qtz4) filling fractures (TXPL); (g) Cube pyrite (Py1) and pyritohedron pyrite (Py2) (RPPL); (h) Quartz (Qtz2) was distributed along the quartz (Qtz1) boundaries and fractures (TXPL); (i) and (j) Large pyrite crystal (Py1) (RPPL); (k) Pyrrhotite (Po) is replaced by chalcopyrite (Ccp) (RPPL); (l) Euhedral cube pyrite (Py4) (RPPL); (m) Py1 was cut by Py2 (RPPL); (n) Quartz (Qtz2) was distributed along the quartz (Qtz1) boundaries and fractures (TXPL); (o) Assemblage of quartz (Qtz4) and calcite (Cal) (TXPL). Red circle points show the locations of in situ sulphur isotope spots. The orange dotted frame show the locations of EPMA mapping. RPPL: reflected plane-polar ised light, TXPL: transmitted crossed-polar ised light. |
| In the text | |
|
Fig. 6 Representative photomicrographs of samples from the Yinggezhuang, Jinniushan, Jinqingding and Shicheng gold deposits. (a) Chalcopyrite (Ccp) filling the fractures of cube pyrite (Py1) and pyritohedron pyrite (Py2) (RPPL); (b) Euhedral cube pyrite (Py4) (RPPL); (c) Assemblage of quartz (Qtz4) and calcite (Cal) (TXPL); (d) Quartz (Qtz2) was distributed along the quartz (Qtz1) boundaries and fractures (TXPL); (e) Cube pyrite (Py1) and pyritohedron pyrite (Py2) (RPPL); (f) Quartz (Qtz2) was distributed along the quartz (Qtz1) boundaries and fractures (TXPL); (g) Pyrite (Py1) is replaced by chalcopyrite (Ccp) (RPPL); (h) Large pyrite crystal (Py1) and fine-grain pyrite (Py2) (RPPL); (i) The boundary between quartz (Qtz2, left) was distributed along the quartz (Qtz1, right) (TXPL); (j), (k), (l) Large pyrite crystal (Py1) (RPPL); (m) Cube pyrite (Py1) and pyritohedron pyrite (Py2) (RPPL); (n) Pyrite (Py1) is replaced by chalcopyrite (Ccp) (RPPL+TXPL); (o) Siderite (Sd), Pyrite (Py4) and quartz (Qtz4) filling fractures (RPPL+TXPL). Red circle points show the locations of in situ sulphur isotope spots. The orange dotted frame show the locations of EPMA mapping. RPPL: reflected plane-polar ised light, TXPL: transmitted crossed-polar ised light. |
| In the text | |
|
Fig. 7 Compilation of δ34S isotope data for sulphides from the Muping–Rushan gold belt. The Kunyushan granitic complex δ34S data from (An et al., 1988; Li and Yang, 1993; Yang et al., 1998). The Jingshan group δ34S data from (Zhang and Chen, 1999). The Jiaodong group δ34S data from (Li and Yang, 1993; Wang et al., 2002; Xu, 1986; Yang et al., 1998). |
| In the text | |
|
Fig. 8 Diagrams of lead isotope ratios for sulphides from Muping–Rushan gold belt. (a) 206Pb/204Pb vs. 207Pb/204Pb; (b) 206Pb/204Pb vs. 208Pb/204Pb; (c) 206Pb/204Pb vs. 208Pb/204Pb Pb isotope evolution diagram; (d) Δβ vs. Δγ genetic classification diagram. Boundaries in diagrams of (a), (b), (c) are after Zartman and Doe (1981). Boundaries in diagrams of (d) are after Zhu et al. (1998). Denggezhuang gold deposit lead isotope data from (Cui, 2012; Yang and Lv, 1996). Yinggezhuang gold deposit lead isotope data from (Zhou, 2010). Jinqingding gold deposit lead isotope data from (Chen, 2010; Li, 1992; Li, 2011; Yang, 2000). The Kunyushan granitic complex lead isotope data from (Hu, 2006; Wang, 1988; Xu, 1986; Yang and Lv, 1996). The Jiaodong group lead isotope data from (Chen, 1989; Wang, 1988). Δβ = 1000×β / (βM-1), Δγ = 1000×γ / (γM-1). β, γ, βM, γM are 207Pb/204Pb and 208Pb/204Pb for sample and mantle, respectively. |
| In the text | |
|
Fig. 9 Helium and argon isotope diagrams of fluid inclusions from the Muping–Rushan gold belt. (a) 4He vs. 3He diagram (modified after (Mamyrin and Tolstikhin, 1984)); (b) 40Ar/36Ar vs. R/Ra diagram (modified after (Burnard et al., 1999)); (c) 40Ar*/4He vs. R/Ra diagram (modified after (Hu et al., 1997)); (d) Location of typical gold deposits. Denggezhuang gold deposit He-Ar isotope data from (Xue et al., 2013; Zhang et al., 2002). Yinggezhuang gold deposit He-Ar isotope data from (Zhou, 2010). Jinqingding gold deposit He-Ar isotope data from (Zhang et al., 2012). R is the 3He/4He ratio of sample; Ra is the 3He/4He ratio of atmosphere (Ra=1.399×10⁻⁶) (Mamyrin et al., 1970). The magmatic field is summarised by Goodwin et al. (2017). (d) Simple map of the Muping–Rushan gold belt showing deposit localities. |
| In the text | |
|
Fig. 10 Genetic model of the Muping–Rushan gold belt (modified from (Deng et al., 2020a; Deng et al., 2020b; Lei et al., 2018)). (a) Late Jurassic (160∼140 Ma) magmatic activity, Kunyushan granitic complex emplacement; (b) Early Cretaceous (120∼110 Ma) magmatic activity, emplacement of the Sanfoshan granite and arc-related mafic dyke; (c) Subsequently (110∼100 Ma), the gold mineralization process of Muping–Rushan gold belt. |
| In the text | |
Current usage metrics show cumulative count of Article Views (full-text article views including HTML views, PDF and ePub downloads, according to the available data) and Abstracts Views on Vision4Press platform.
Data correspond to usage on the plateform after 2015. The current usage metrics is available 48-96 hours after online publication and is updated daily on week days.
Initial download of the metrics may take a while.