")
")
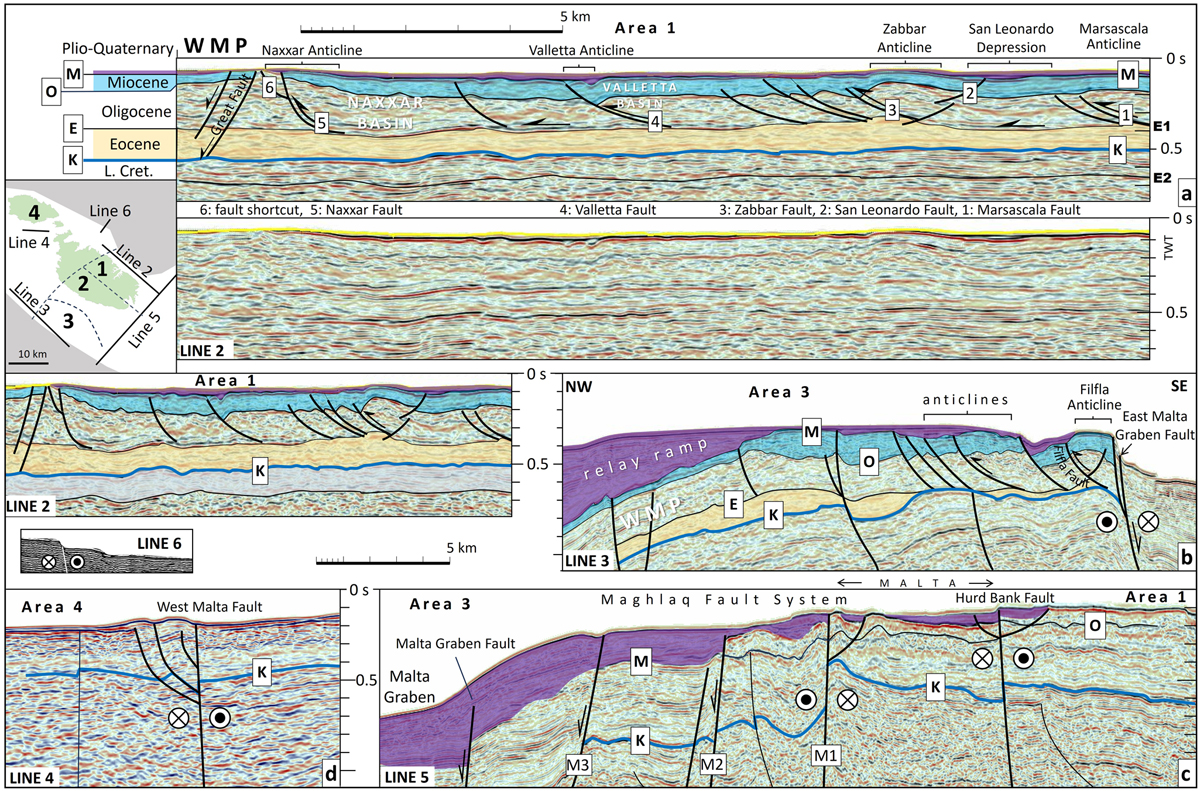
Fig. 4
Download original image
Map of Areas 1, 2, 3, and 4 and location of seismic lines 2 to 6. (a) Interpreted and uninterpreted seismic line in Area 1. (b) Seismic line 2 showing thrusts that sole along E1 gypsum bed. Seismic line 3 showing relay ramp produced during Phase D. (c) Seismic line 5 showing negative flower structure over Hurd bank Fault and positive flower structure over Maghlaq Fault. (d) Positive flower structure over West Malta Fault (b, c, and d same scale).
Current usage metrics show cumulative count of Article Views (full-text article views including HTML views, PDF and ePub downloads, according to the available data) and Abstracts Views on Vision4Press platform.
Data correspond to usage on the plateform after 2015. The current usage metrics is available 48-96 hours after online publication and is updated daily on week days.
Initial download of the metrics may take a while.