")
")
Open Access
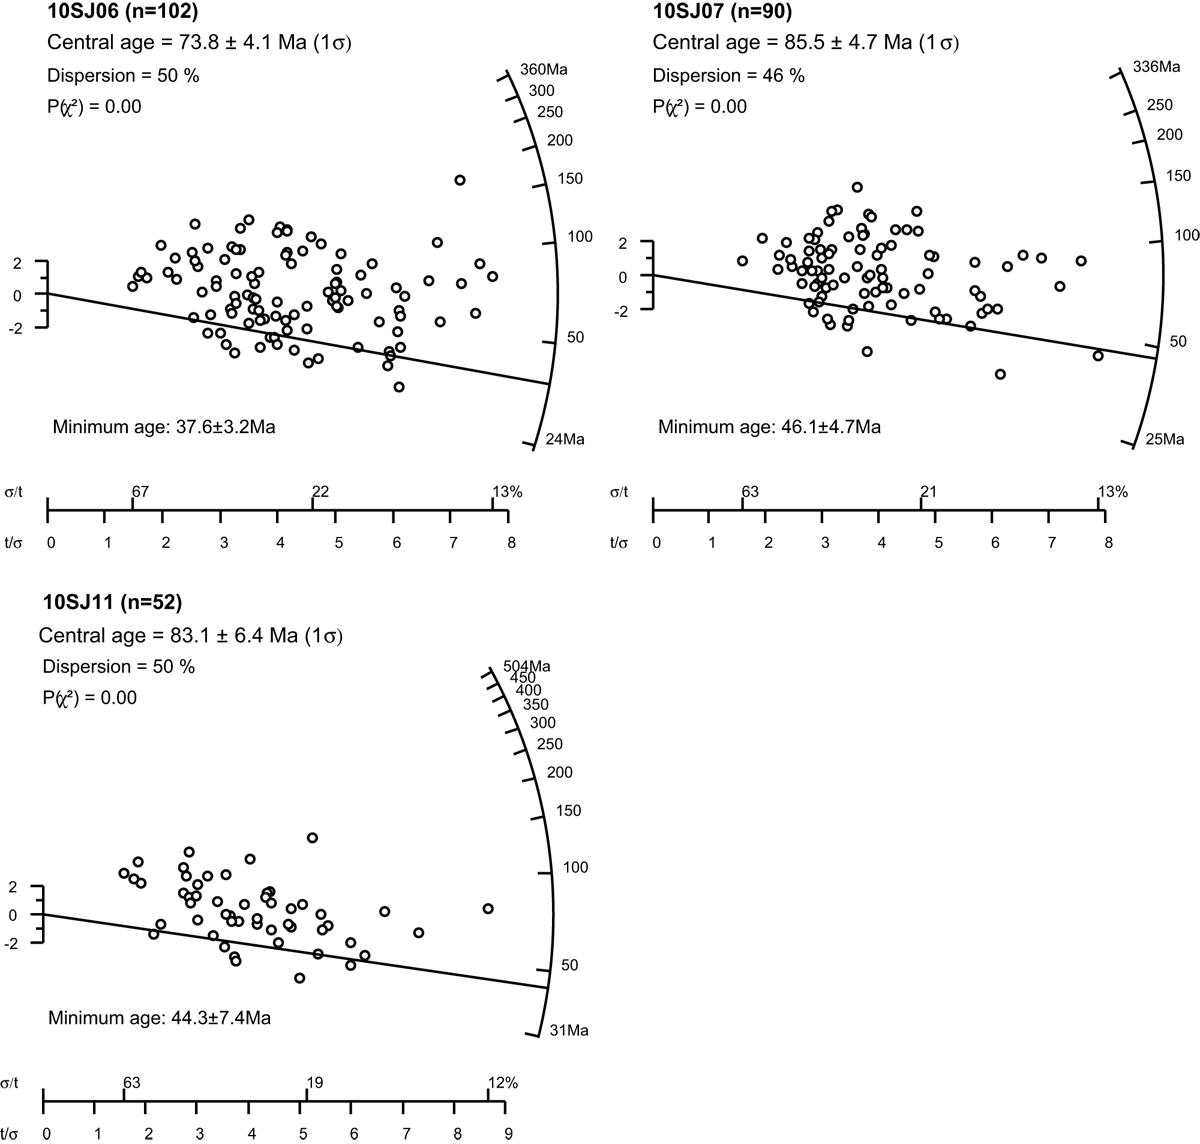
Fig. 3
Download original image
Detrital AFT age data shown in radial plots for samples 10SJ06 and 10SJ07 of Formation 2, and sample 10SJ11 of Formation 3. Graphs were plotted and central and minimum ages were calculated with the RadialPlotter program by Vermeesch (2009).
Current usage metrics show cumulative count of Article Views (full-text article views including HTML views, PDF and ePub downloads, according to the available data) and Abstracts Views on Vision4Press platform.
Data correspond to usage on the plateform after 2015. The current usage metrics is available 48-96 hours after online publication and is updated daily on week days.
Initial download of the metrics may take a while.