")
")
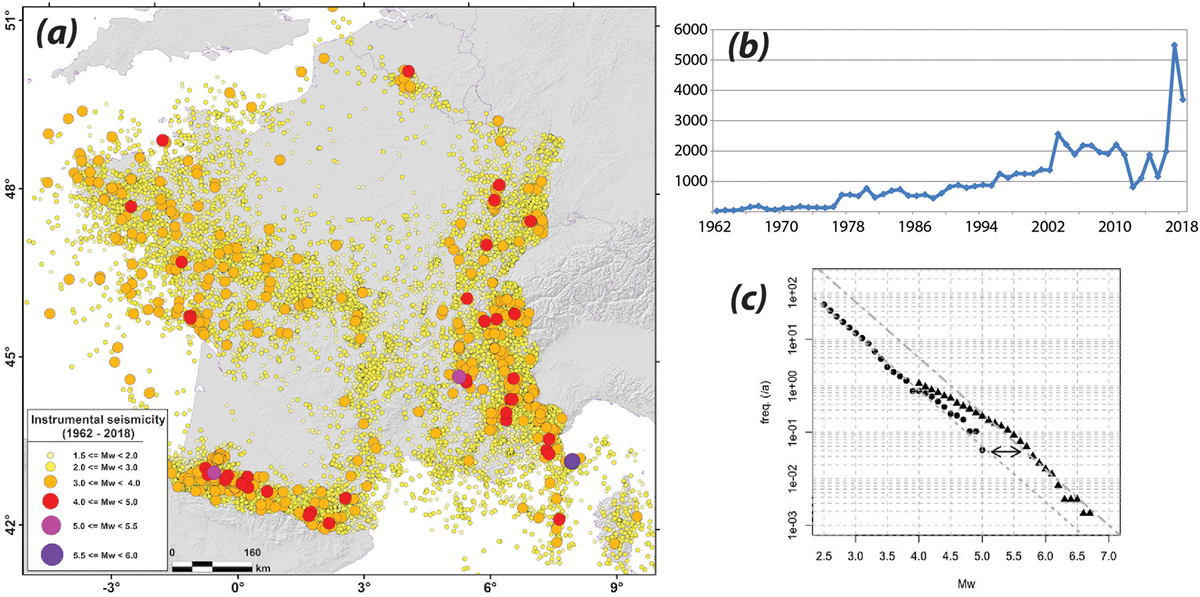
Fig. 2
Download original image
Instrumental seismicity in metropolitan France. (a) Map of the extended SI-Hex catalogue (1962–2018). Colored circles indicate earthquake magnitudes Mw. (b) Number of recorded earthquakes per year. (c) Cumulative magnitude-frequency distribution of seismicity. Solid circles: Instrumental SI-Hex catalogue (1962–2018), Mw ≥ 2.5. Solid triangles: historical & instrumental FCAT17 catalogue (Manchuel et al., 2018), Mw ≥ 4.0. Dotted and dashed grey lines show best-fit Gutenberg-Richter models for each catalogue, with the double-head arrow indicating an apparent offset of 0.5 magnitude point.
Current usage metrics show cumulative count of Article Views (full-text article views including HTML views, PDF and ePub downloads, according to the available data) and Abstracts Views on Vision4Press platform.
Data correspond to usage on the plateform after 2015. The current usage metrics is available 48-96 hours after online publication and is updated daily on week days.
Initial download of the metrics may take a while.