")
")
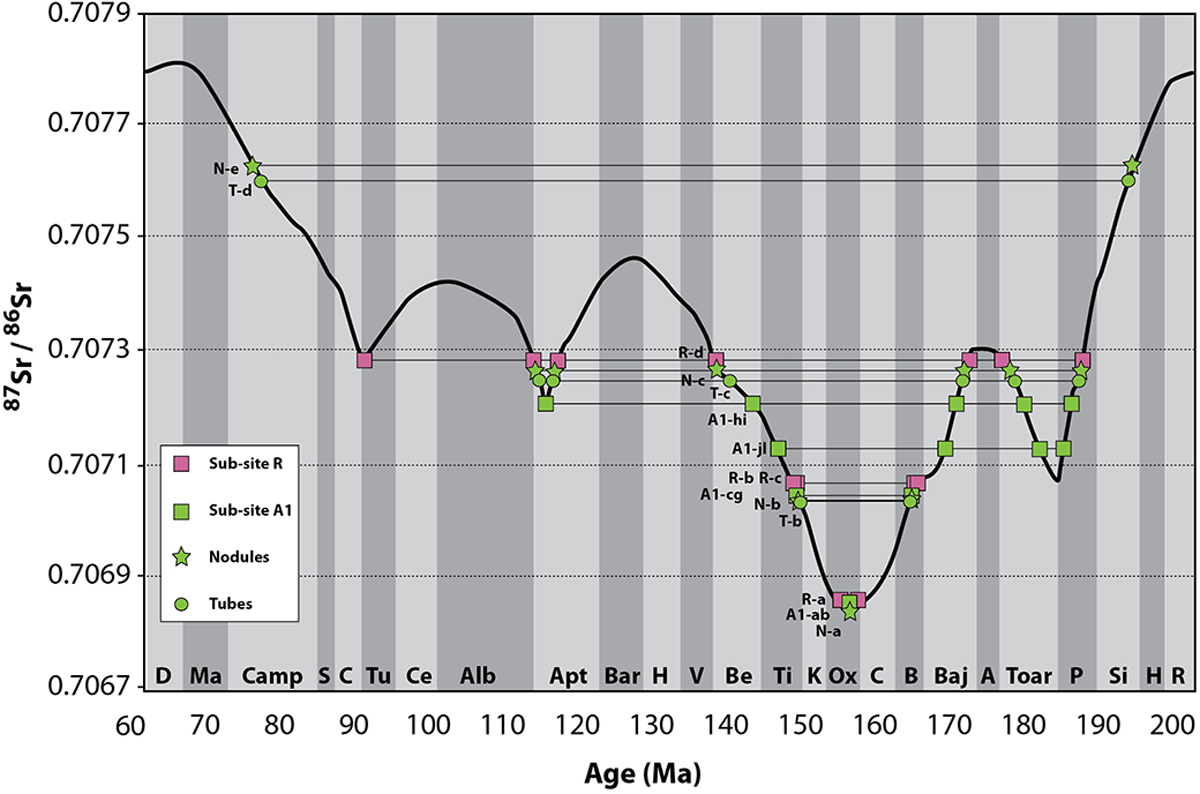
Fig. 3
Download original image
87Sr/86Sr ratios measured on all samples (Tubes T, Nodules N, sub-site A1 and sub-site R) were reported on the strontium isotopic curve (black curve of the figure) from McArthur et al. (2012) and the Middle-Upper Jurassic revised version of Wierzbowski et al. (2017). At the bottom the abbreviated geological periods are indicated from the Rhetian (R on the right) to the Danian (D on the left).
Current usage metrics show cumulative count of Article Views (full-text article views including HTML views, PDF and ePub downloads, according to the available data) and Abstracts Views on Vision4Press platform.
Data correspond to usage on the plateform after 2015. The current usage metrics is available 48-96 hours after online publication and is updated daily on week days.
Initial download of the metrics may take a while.