")
")
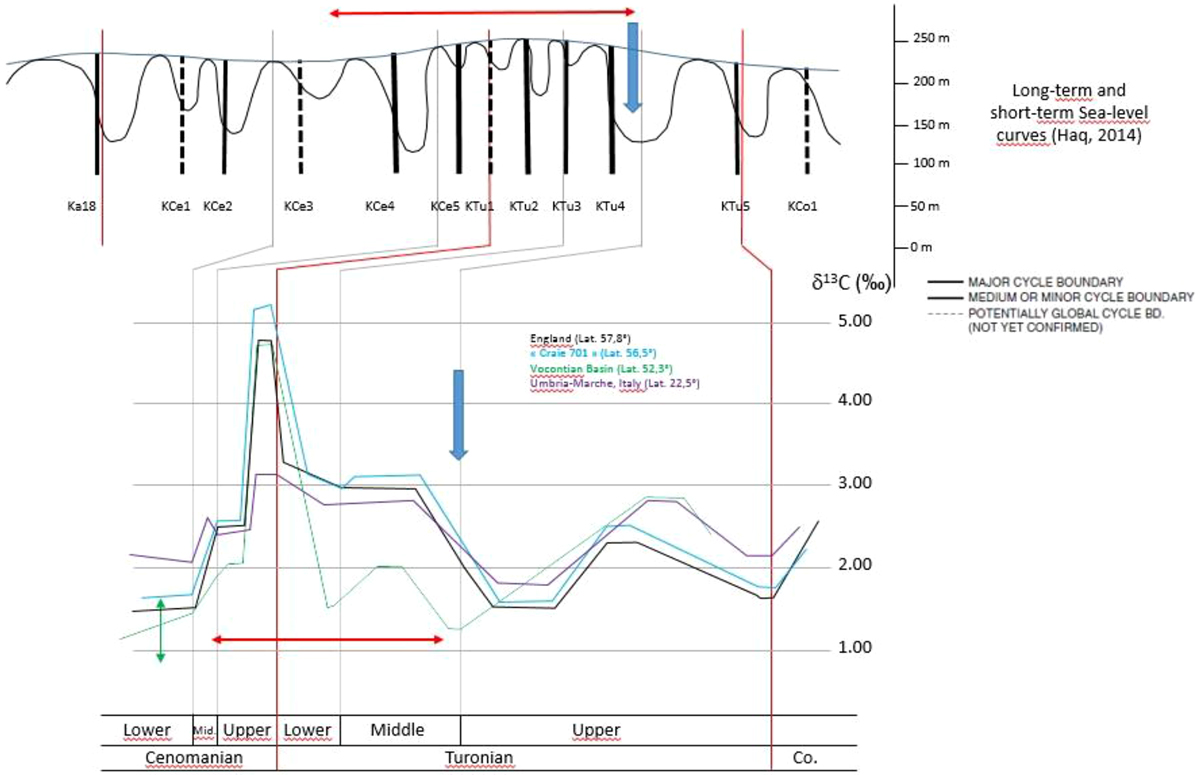
Fig. 6
Download original image
Composite δ13C curves for epicontinental basin (Culver Cliff section and Craie 701 borehole) compared with pelagic basin (Vocontian Basin sections and Gubbio succession for the Cenomanian-Turonian interval. Comparison of the δ13C curves with the sea level changes (Haq, 2014). The red line represents a high sea level time and the blue arrow a huge regression.
Current usage metrics show cumulative count of Article Views (full-text article views including HTML views, PDF and ePub downloads, according to the available data) and Abstracts Views on Vision4Press platform.
Data correspond to usage on the plateform after 2015. The current usage metrics is available 48-96 hours after online publication and is updated daily on week days.
Initial download of the metrics may take a while.