")
")
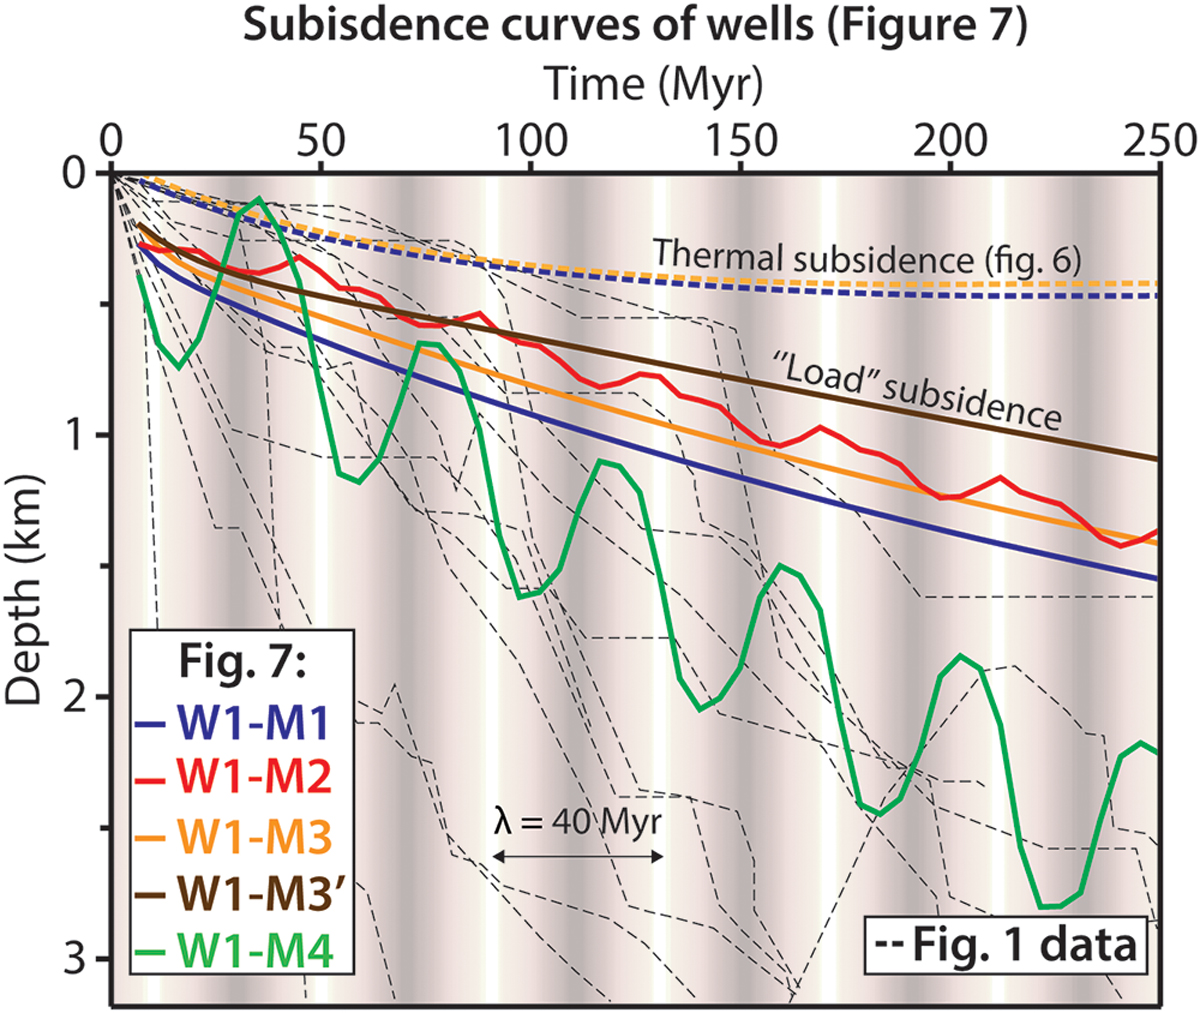
Fig. 8
Download original image
Subsidence curves from different models in Figure 7 (wells W1-M1 to W1-M4) associated with Figure 1 bibliographic data. The subsidence of W1-M1, W1-M3 and W1-M3’ is constant after 250 Myr (i.e. still have a potential of subsidence), in contrast with the subsidence of W1-A1 and W1-A2 where it stops after 150 Myrs. The wells W1-M2 and W1-M4 show linear decay subsidence with deviations of different amplitude. See Figure 4B for the boundary conditions.
Current usage metrics show cumulative count of Article Views (full-text article views including HTML views, PDF and ePub downloads, according to the available data) and Abstracts Views on Vision4Press platform.
Data correspond to usage on the plateform after 2015. The current usage metrics is available 48-96 hours after online publication and is updated daily on week days.
Initial download of the metrics may take a while.