")
")
Open Access
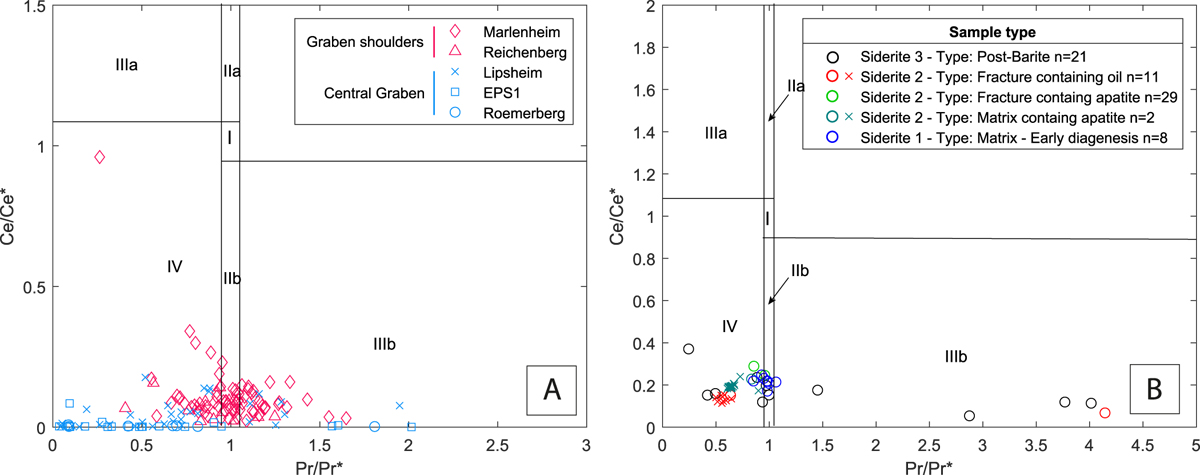
Fig. 13
Download original image
Cerium and Lanthanum anomalies represented on a Ce/Ce*SN vs Pr/Pr*SN diagrams after Bau and Dulski (1996). (A) For barite. (B) For siderite, where “x” crosses represent samples from Lipsheim, and circle samples from Roemerberg. See text for the domains definition.
Current usage metrics show cumulative count of Article Views (full-text article views including HTML views, PDF and ePub downloads, according to the available data) and Abstracts Views on Vision4Press platform.
Data correspond to usage on the plateform after 2015. The current usage metrics is available 48-96 hours after online publication and is updated daily on week days.
Initial download of the metrics may take a while.