")
")
Fig. 9
Download original image
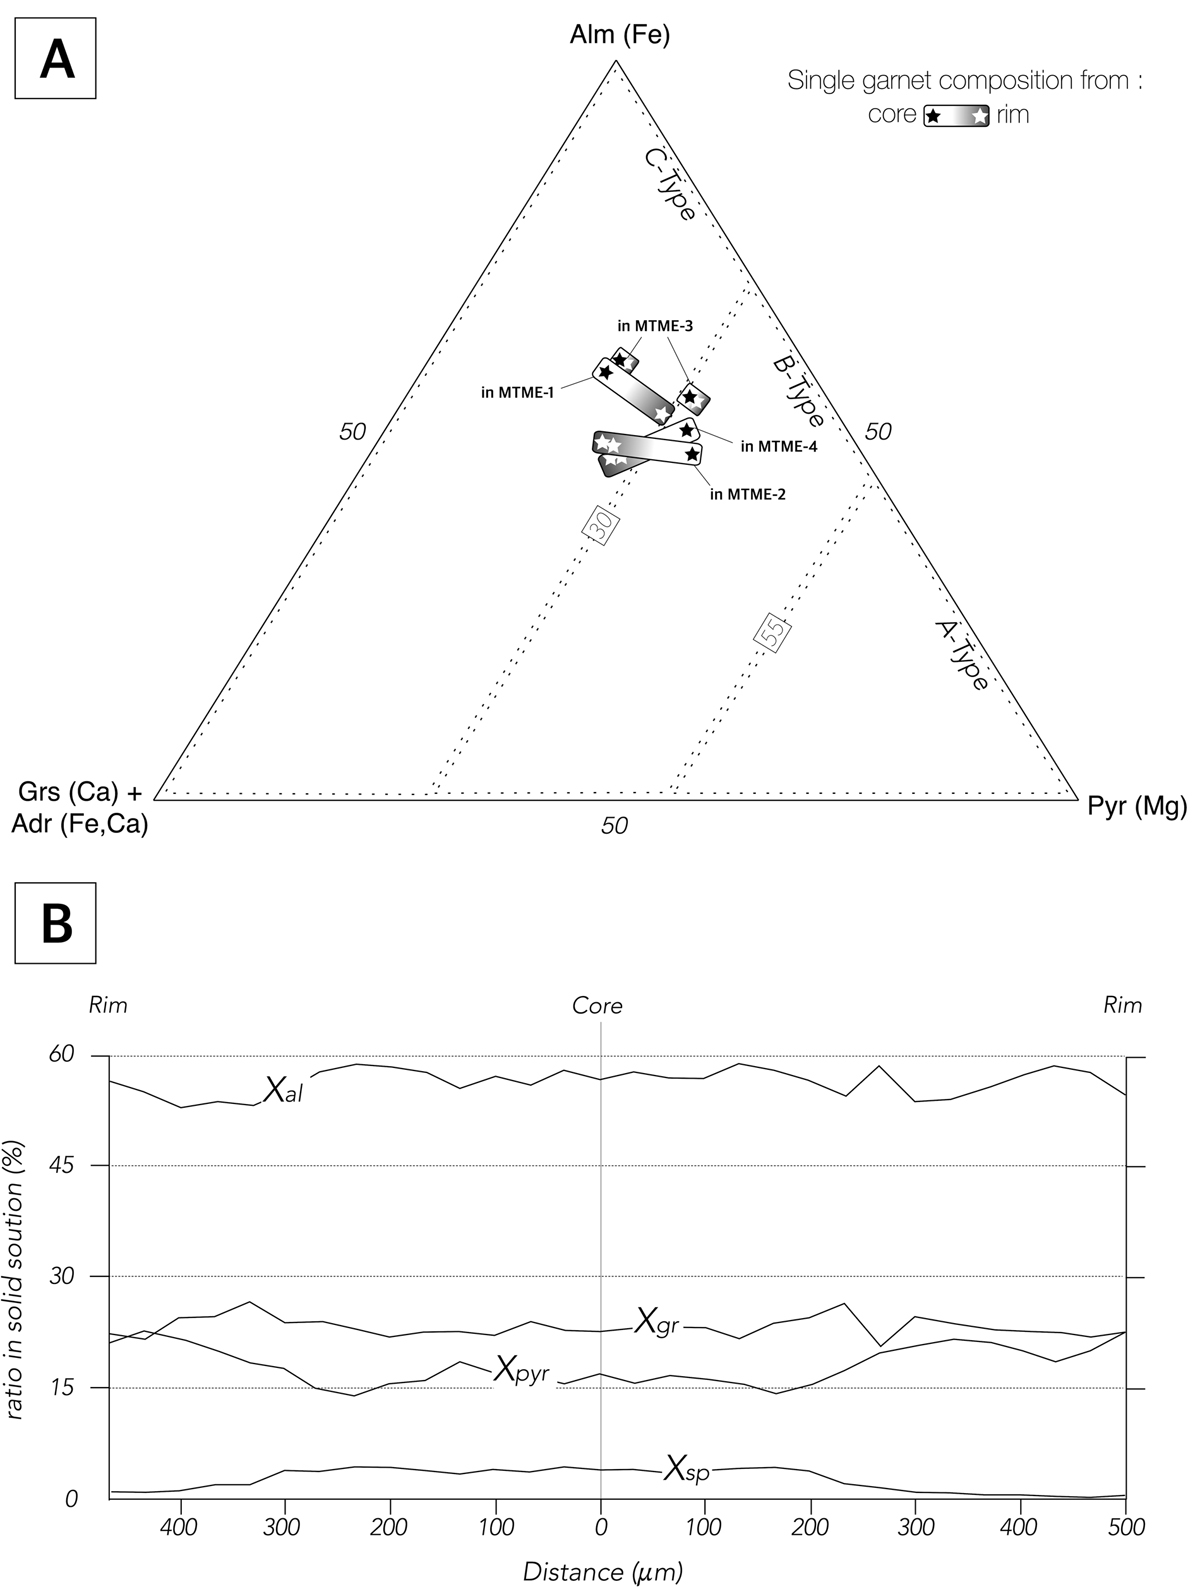
(A) Compositions of garnet in the diagram of Coleman et al. (1965). Core to rim zonations are indicated. (B) Rim-to-rim chemical zoning in one millimetric garnet from MTME1 sample (represented in the previous diagram). Data are from garnet imaged in Figure 7D.
(A) Composition chimique des grenats dans le diagramme de Coleman et al. (1965), montrant les évolutions depuis les cœurs vers les bordures de grains. (B) Profil de zonation chimique d’un grenat millimétrique de l’échantillon MTME-1 (identifié dans le diagramme précédent). Les analyses ont été effectuées sur le grenat de la figure 7D.
Current usage metrics show cumulative count of Article Views (full-text article views including HTML views, PDF and ePub downloads, according to the available data) and Abstracts Views on Vision4Press platform.
Data correspond to usage on the plateform after 2015. The current usage metrics is available 48-96 hours after online publication and is updated daily on week days.
Initial download of the metrics may take a while.