")
")
Open Access
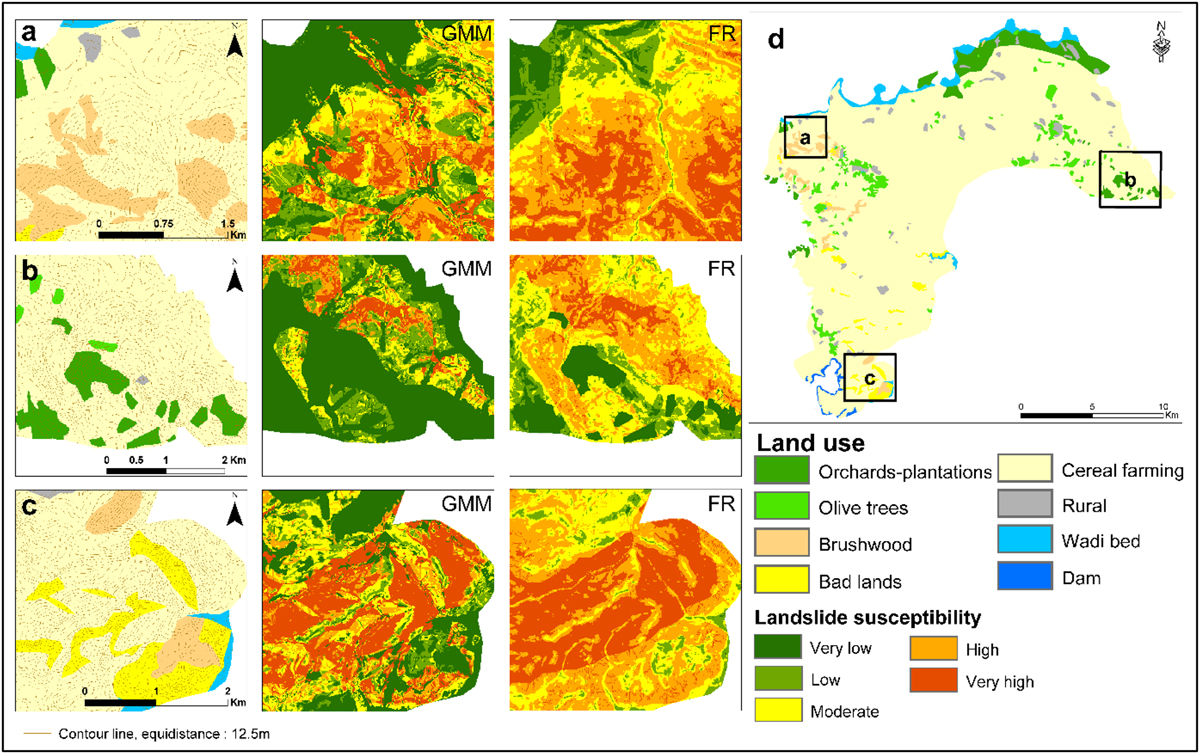
Fig. 7
Download original image
Landslide susceptibility maps with the location of movements used for validation, a GIS Matrix Method map, b Frequency Ratio map.
Current usage metrics show cumulative count of Article Views (full-text article views including HTML views, PDF and ePub downloads, according to the available data) and Abstracts Views on Vision4Press platform.
Data correspond to usage on the plateform after 2015. The current usage metrics is available 48-96 hours after online publication and is updated daily on week days.
Initial download of the metrics may take a while.