")
")
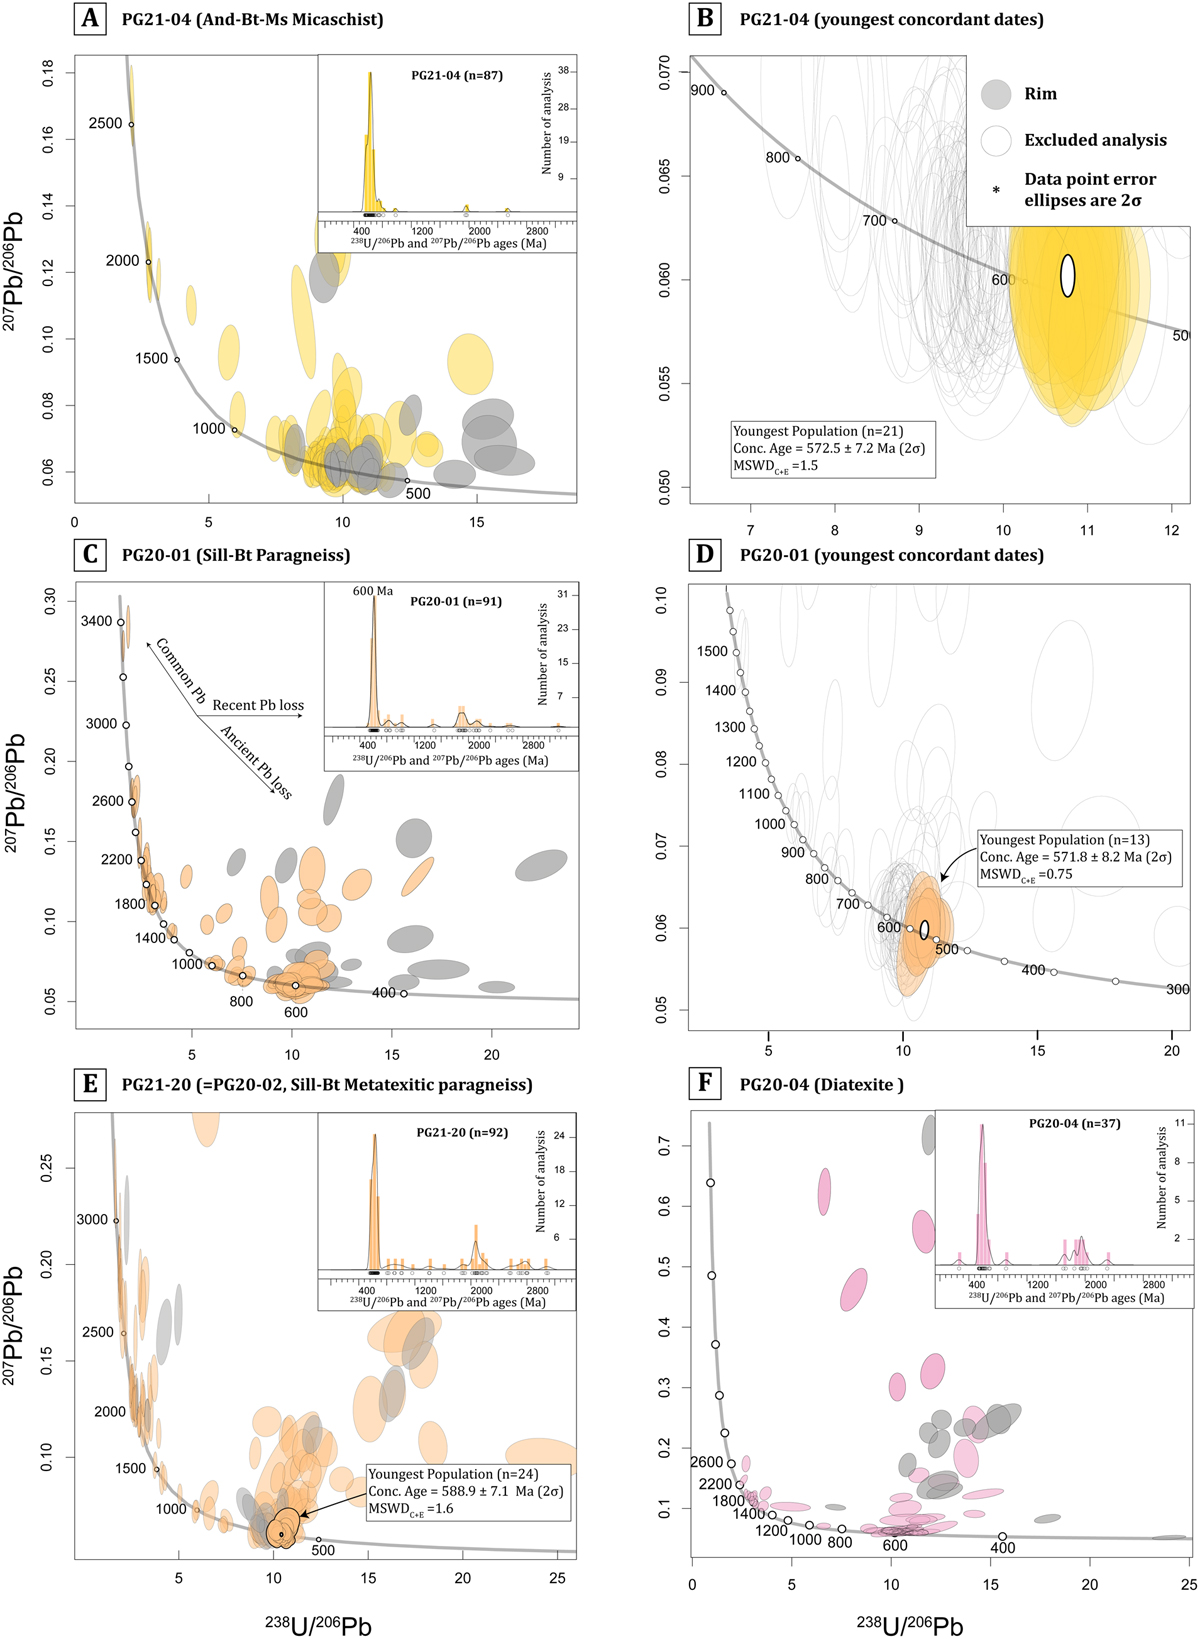
Fig. 7
Download original image
Concordia diagrams (Tera–Wasserburg, 238U/206Pb vs. 207Pb/206Pb) and kernel density estimate (KDE) plots showing the distribution of U–Pb isotopic analyses for metasedimentary rocks: (A–B) PG21-04 micaschist; (C–D) PG20-01 paragneiss; (E) PG20-02 paragneiss; and (F) PG20-04 diatexite. In (A), (C), (E) and (F), grey circles indicate rim analyses; in (B) and (D), empty circles are excluded from the calculation of Concordia dates. Only analyses with less than 5 per cent discordance (206Pb/238U ÷ 206Pb/207Pb age × 100) are included in the KDE plots.
Current usage metrics show cumulative count of Article Views (full-text article views including HTML views, PDF and ePub downloads, according to the available data) and Abstracts Views on Vision4Press platform.
Data correspond to usage on the plateform after 2015. The current usage metrics is available 48-96 hours after online publication and is updated daily on week days.
Initial download of the metrics may take a while.