")
")
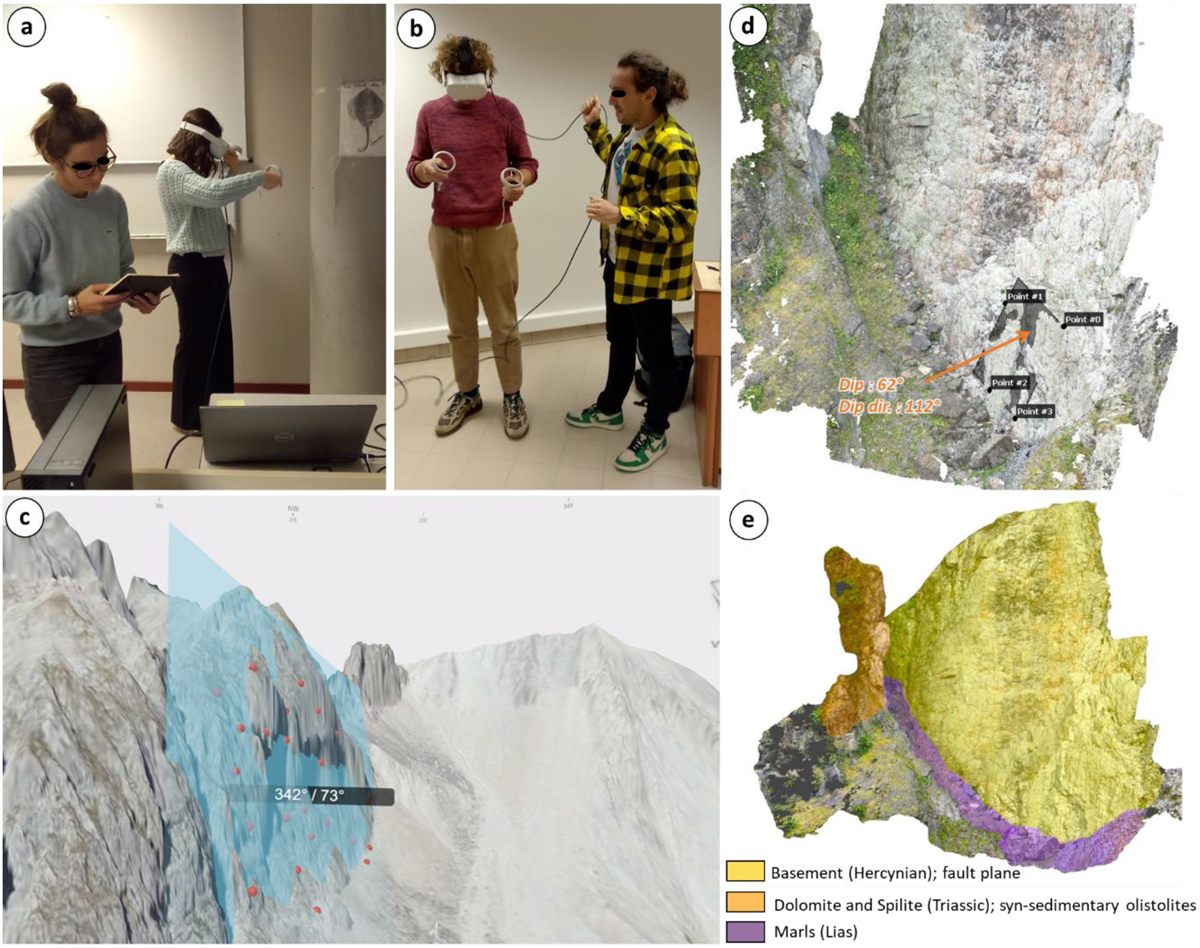
Fig. 6
Download original image
a) and b) Immersion in the OceanField data using VRExplorer software. In groups of two, while one student works in the virtual environment, their partner assists them by controlling from the screen or guiding them through the space. After a while, the roles are swapped. c) Example of measurement of dip direction and dip (in degrees) carried out in the VRExplorer virtual environment, at the Béraudes study area.
Current usage metrics show cumulative count of Article Views (full-text article views including HTML views, PDF and ePub downloads, according to the available data) and Abstracts Views on Vision4Press platform.
Data correspond to usage on the plateform after 2015. The current usage metrics is available 48-96 hours after online publication and is updated daily on week days.
Initial download of the metrics may take a while.