")
")
Fig. 10
Download original image
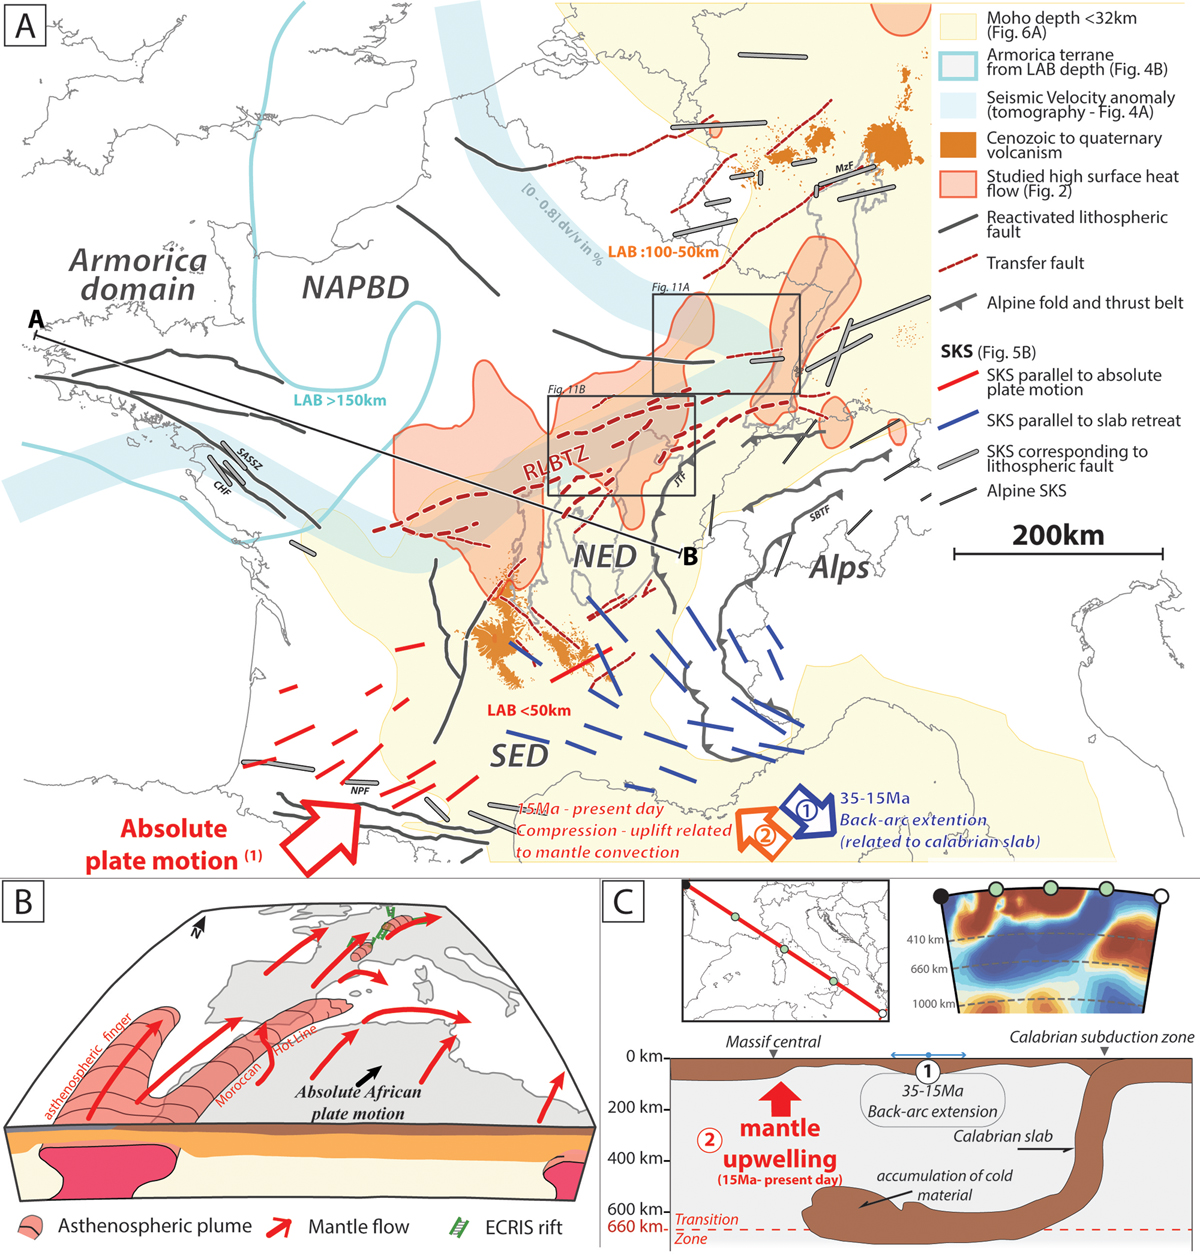
Characterization of the upper mantle flows. A: Synthetic map considering the Moho depth, the LAB depth, the tomography anomalies, the high surface temperature, the SKS splitting data and the location of lithospheric and transfer faults. B: Schematic illustration of Oligocene to present mantle flow (modified from Jolivet et al., 2022). C: Mantle flow upwellings related to the Calabrian slab (modified from Faccenna et al., 2010).
Current usage metrics show cumulative count of Article Views (full-text article views including HTML views, PDF and ePub downloads, according to the available data) and Abstracts Views on Vision4Press platform.
Data correspond to usage on the plateform after 2015. The current usage metrics is available 48-96 hours after online publication and is updated daily on week days.
Initial download of the metrics may take a while.