Fig. 1

Download original image
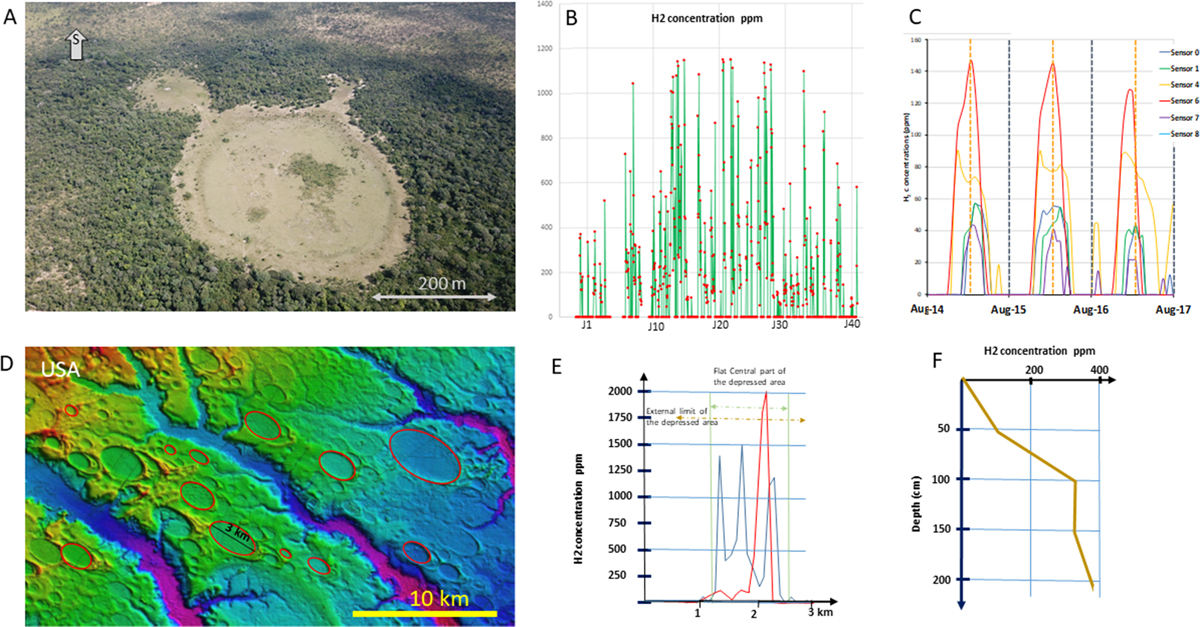
Synthesis of the fairy circle emissions characteristics. A. A fairy circle in Brazil showing how the vegetation is affected. B. Variability on time over 5 weeks for a given sensor in the structure monitored in Brazil. See Prinzhofer et al. (2019) and Myagkiy et al. (2020) for details about that case. C. Daily variations for 6 sensors installed on the structure monitored in Brazil showing the 24 h period. D. Variability in size, of the emitting structures in USA (modified from Prinzhofer and Deville, 2015). E. Two profiles across a structure showing the spatial variability of H2 concentration value between the center and the rim of the structure, Lake Podowoye, Russia. These values have not been taken at the same time but over 2 days. Modified from Larin et al. (2014). F. Profile showing an example of [H2] concentration variation versus depth in USA (modified from Zgonnik et al., 2015).
Les statistiques affichées correspondent au cumul d'une part des vues des résumés de l'article et d'autre part des vues et téléchargements de l'article plein-texte (PDF, Full-HTML, ePub... selon les formats disponibles) sur la platefome Vision4Press.
Les statistiques sont disponibles avec un délai de 48 à 96 heures et sont mises à jour quotidiennement en semaine.
Le chargement des statistiques peut être long.


