")
")
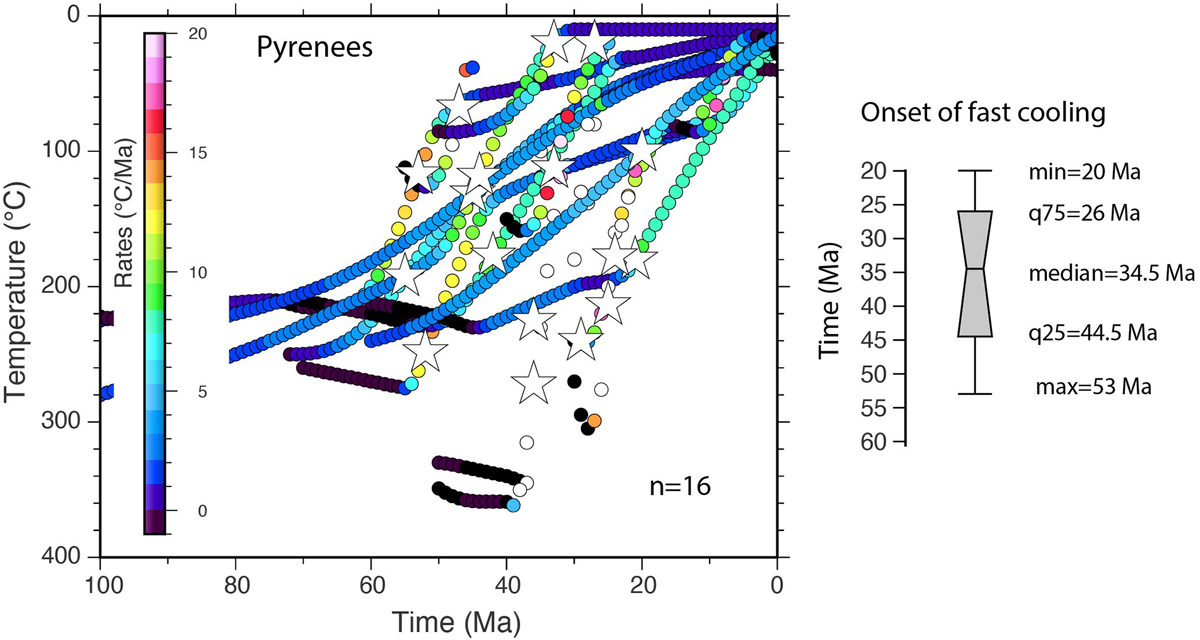
Fig. 13
Download original image
Principle of the analysis of published cooling paths (n = 16) with example taken from the Pyrenees. Left: Cooling paths are colored as a function of cooling rates. Stars depict the time of maximum cooling that is assumed to reflect the period of orogenic growth and exhumation. Right: box-plot showing temporal distribution of exhumation maximum. From this we infer that exhumation reached a climax between 44.5 and 26 Ma, which correspond to the time at which orogenic topography and crustal root developed. In this example model cooling histories are after (Gunnell et al., 2009; Bosch et al., 2016; Vacherat et al., 2016; Fillon et al., 2021; Waldner et al., 2021).
Current usage metrics show cumulative count of Article Views (full-text article views including HTML views, PDF and ePub downloads, according to the available data) and Abstracts Views on Vision4Press platform.
Data correspond to usage on the plateform after 2015. The current usage metrics is available 48-96 hours after online publication and is updated daily on week days.
Initial download of the metrics may take a while.