")
")
Fig. 2
Download original image
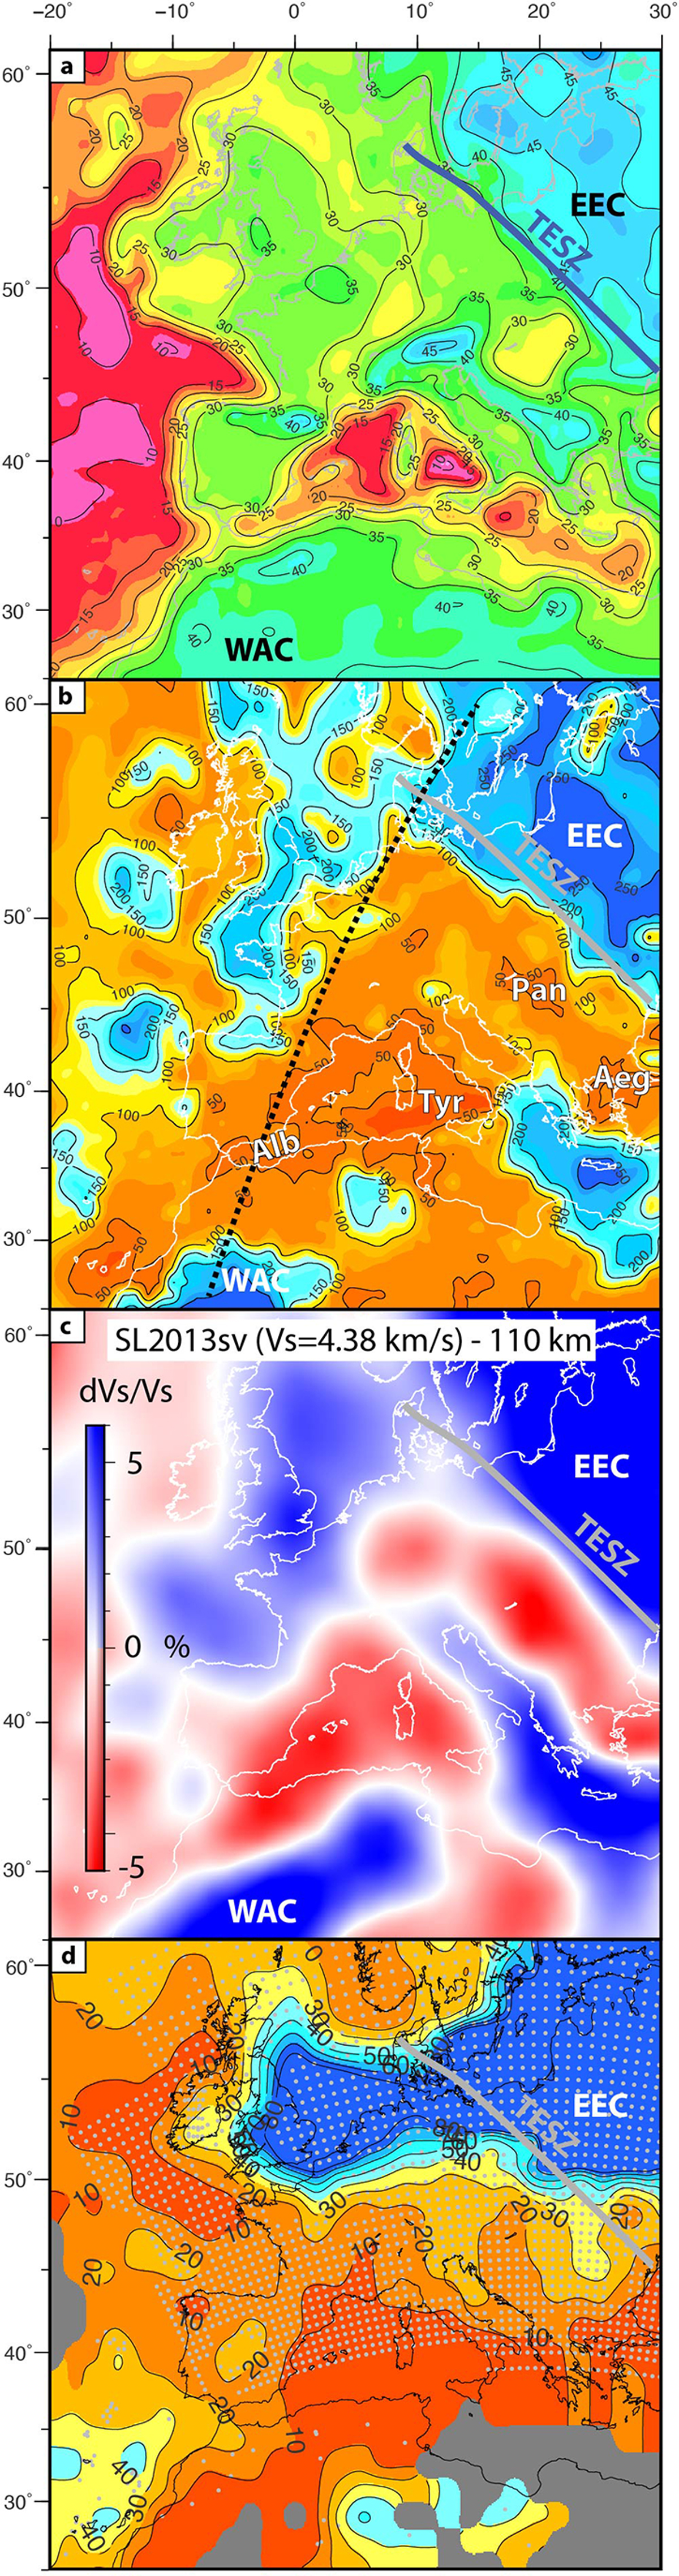
Deep structure of the continental lithosphere of Europe. (a) Moho depth after EPcrust model (Molinari and Morelli, 2011). (b) Seismic lithosphere thickness (also LAB Lithosphere-Asthenosphere Boundary) after global model LITHO1.0 (Pasyanos et al., 2014). Dashed black line depict location of profile shown in Figure 3. Alb: Alboran Basin; Aeg: Aegean Basin; Tyr: Tyrrhenian Basin; Pan: Pannonian Basin. (c) S-wave velocity anomalies at 110 km for velocities of reference Vs = 4.38 km/s after global Vs model SL2013sv obtained from inversion of surface and S-wave forms (Schaeffer and Lebedev, 2013). (d) Effective elastic thickness (Te) in km as obtained from combination of spectral admittance and coherence between Bouguer gravity anomaly data and forward modelling of the gravity anomalies and the present-day topography/bathymetry (Mouthereau et al., 2013). Data points used in the model are indicated as small grey dots.
Current usage metrics show cumulative count of Article Views (full-text article views including HTML views, PDF and ePub downloads, according to the available data) and Abstracts Views on Vision4Press platform.
Data correspond to usage on the plateform after 2015. The current usage metrics is available 48-96 hours after online publication and is updated daily on week days.
Initial download of the metrics may take a while.