")
")
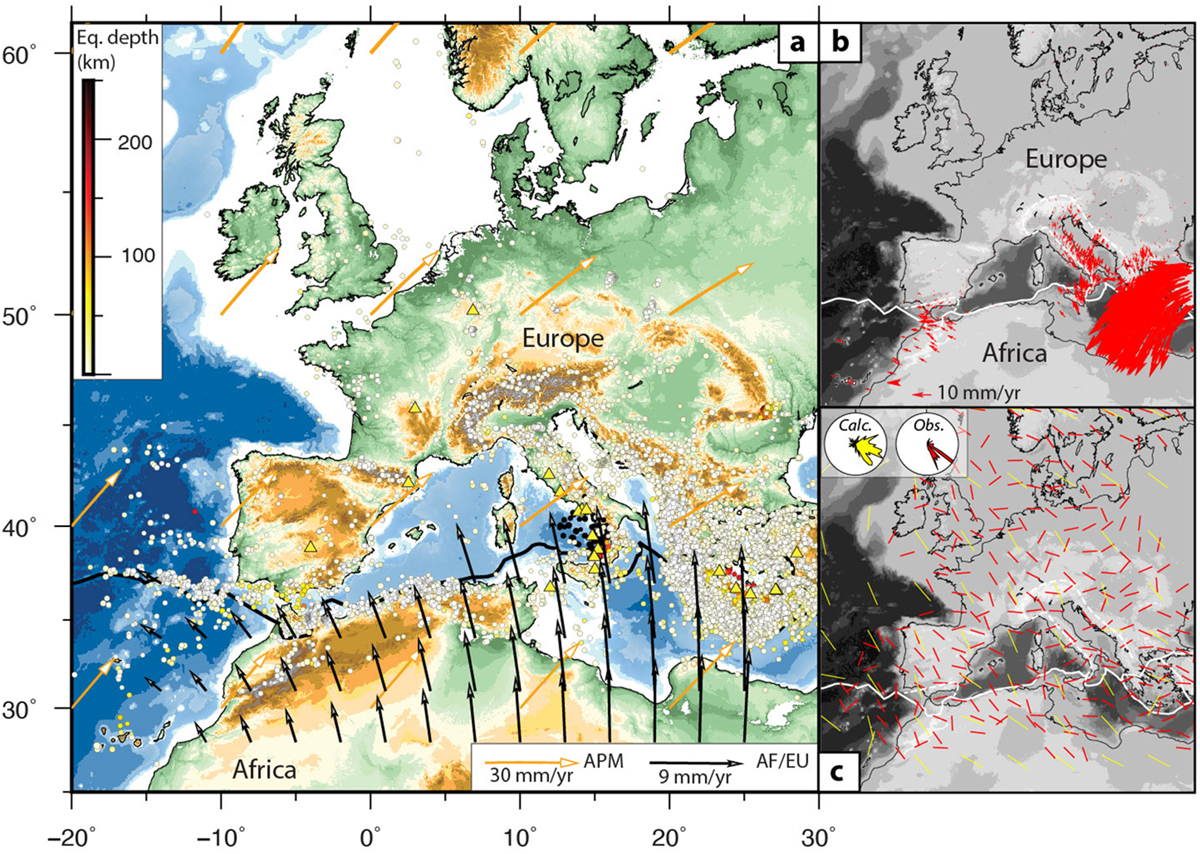
Fig. 20
Download original image
(a) Present-day plate motions and earthquakes distribution across Europe and northern Africa plate boundary. Orange arrows refer to absolute plate motions calculated according to NNR-MORVEL56 model (Argus et al., 2011). Black arrows are Africa velocities inferred from the same kinematic model but calculated in a Europe-fixed reference frame. Yellow triangle are plio-quaternary volcanoes. Earthquakes depths (0–250 km) and magnitudes (M > 3.5) are from the ISC (International Seismological Center) catalogue spanning the period 1990–2019. Black thick line is the plate boundary after MORVEL56 model (Argus et al., 2011). (b) GPS results plotted relative to Europe fixed reference frame (Nocquet, 2012). (c) Smoothed representation of maximum horizontal compressional stress (SHmax; red bars) after the 2016 World Stress Map (Heidbach et al., 2018) compare to maximum compressional deviatoric stress orientations (yellow bars) calculated from a global coupled lithosphere and mantle dynamic model (Ghosh et al., 2013). Insets show rose diagrams of stress directions for both observed and model stress directions.
Current usage metrics show cumulative count of Article Views (full-text article views including HTML views, PDF and ePub downloads, according to the available data) and Abstracts Views on Vision4Press platform.
Data correspond to usage on the plateform after 2015. The current usage metrics is available 48-96 hours after online publication and is updated daily on week days.
Initial download of the metrics may take a while.