")
")
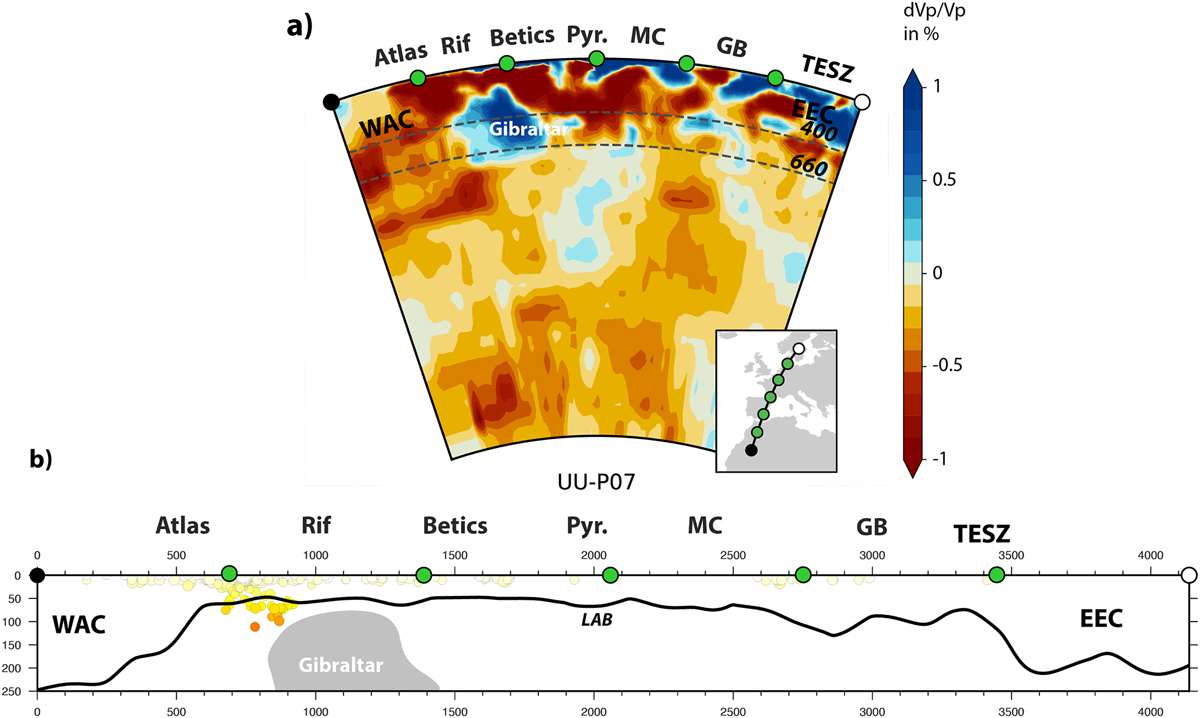
Fig. 3
Download original image
P-wave seismic tomography and lithosphere thickness variations across Western Europe. (a) P-wave velocities anomalies from global model UU-P07 (Amaru, 2007) along a section stretching between the East European Craton (Sweden) and the Western African Craton (Morocco). (b) Seismic lithosphere thickness after model LITHO1.0 (Pasyanos et al., 2014) along the same transect. Position of the high Vp anomaly corresponding to the Gibraltar slab in (a) is shown in grey. Hypocenters of major earthquakes are also shown. Abbreviations: Pyr.: Pyrenees; MC: Massif Central; GB: German Basin.
Current usage metrics show cumulative count of Article Views (full-text article views including HTML views, PDF and ePub downloads, according to the available data) and Abstracts Views on Vision4Press platform.
Data correspond to usage on the plateform after 2015. The current usage metrics is available 48-96 hours after online publication and is updated daily on week days.
Initial download of the metrics may take a while.