")
")
| Issue |
BSGF - Earth Sci. Bull.
Volume 192, 2021
Special Issue Orogen lifecycle: learnings and perspectives from Pyrenees, Western Mediterranean and analogues
|
|
|---|---|---|
| Article Number | 40 | |
| Number of page(s) | 3 | |
| DOI | https://doi.org/10.1051/bsgf/2021038 | |
| Published online | 8 octobre 2021 | |
Erratum to: Decoding low-temperature thermochronology signals in mountain belts: modelling the role of rift thermal imprint into continental collision
BSGF − Earth Sciences Bulletin 2021, 192, 38, https://doi.org/10.1051/bsgf/2021028
Erratum de : Décrypter les signaux de thermochronologie basse température dans les chaînes de montagnes : modéliser le rôle de l’héritage thermique des marges dans la collision continentale
1
Institut des Sciences de la Terre d’Orléans (ISTO), UMR 7327, Université d’Orléans, CNRS, BRGM,
45000
Orléans, France
2
Géosciences Paris-Saclay (GEOPS), UMR 8184, Université Paris-Saclay, CNRS,
91405
Orsay, France
3
Géosciences Rennes, UMR 6118, Université de Rennes 1, CNRS,
35042
Rennes, France
4
Géosciences Environnement Toulouse (GET), Université de Toulouse, CNRS, IRD, CNES, UPS,
31400
Toulouse, France
5
TotalEnergies, Centre Scientifique et Technique Jean Féger (CSTJF),
64000
Pau, France
* Corresponding author: Cette adresse e-mail est protégée contre les robots spammeurs. Vous devez activer le JavaScript pour la visualiser.
Figures 4B and 4C in the original publication of this article (published September 1st, 2021) are incorrect, not corresponding to their figure caption, and the insert caption that explains the color scheme in Figure 3C is missing. In particular, the originally correct Figures 4B and 4C were inadvertently replaced by the authors with Figures 3B and 3C during the revision process.
In Figure 4B, graphs showing predicted chlorine content-dependent apatite and annealing model-dependent zircon mean track length data (MTL) plotted against model ages are wrong and appear as a duplicate of graphs showing predicted chlorine content-dependent apatite and annealing model-dependent zircon mean track length data (MTL) plotted against model ages in Figure 3B.
In Figure 4C, graphs showing individual particles’ model time-temperature paths extracted from Model B (model of non-inverted, thermally-relaxed rifted margins) are wrong and appear as a duplicate of graphs showing individual particles’ model time-temperature paths extracted from Model A (model of inverted rifted margins) in Figure 3C.
As this Erratum is only a matter of results display, the corrected figures provided below do not affect the results nor discussion and conclusion in the published original article.
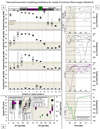 |
Fig. 3 Thermochronometric modelling predictions for model of inverted rifted margins (Model A; Fig. 1A). (A) Model thermochronological ages for the four low-temperature thermochronometers considered in this study. Low-temperature thermochronometers are apatite (U-Th)/He (AHe), apatite fission-track (AFT), zircon (U-Th)/He (ZHe) and zircon fission-track (ZFT) systems. Age predictions are plotted as boxplots against particle number and solid black squares represent model mean ages. PD: proximal domain, also margin; ND: necking domain; HE: hyperextended domain; EM: exhumed mantle domain. (B) Predicted chlorine content-dependent apatite and annealing model-dependent zircon mean track length data (MTL) plotted against model ages. Error bars shown for predicted MTL represent the standard deviation SD calculated by the software program QTQt (Gallagher, 2012; v5.7.1) and the colour scheme corresponds to margin domains as in (A) and Figure 1. Circles represent lower plate particles 1–8 and diamonds represent upper plate particles 9–14. For a given domain, colour shade allows differentiating particles from one another (for instance, regarding hyperextended domains, light purple corresponds to particle 6 while dark purple corresponds to particle 8). For each particle, four apatite age-MTL and three zircon age-MTL are predicted, depending on apatite chlorine content range and annealing model tested. In the AFT plot, point size increases with chlorine content. In the ZFT plot, small-sized points correspond to predictions obtained using the Yamada et al. (2007) short-time annealing model while medium-sized points correspond to predictions obtained using the Tagami et al. (1998) model. Large-sized points are indistinguishable as the Yamada et al. (2007) long-time annealing model yields the same results. They are represented in black. (C) Individual particles’ model time-temperature paths extracted from Model A (Figs. 1 and SI01). The colour scheme corresponds to margin domains as in (A) and Figure 1. Each plot represents one type of domain, irrespective of the plate (from bottom to top: exhumed mantle domain, hyperextended domains, necking domains, proximal domains) Ap.: apatite; Zr.: zircon; PAZ: fission-track partial annealing zone; PRZ: helium partial retention zone. Model data in (A) and (B) are generated for each particle through QTQt forward modelling of their individual time-temperature path in (C). Brown bars indicate the ages of extension and transition from extension to convergence in Model A (Fig. 1). |
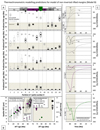 |
Fig. 4 Thermochronometric modelling predictions for model of non-inverted, thermally-relaxed rifted margins (Model B; Fig. 2). (A) Model thermochronological ages for the four low-temperature thermochronometers considered in this study. Age patterns predicted for Model A (Fig. 3) are plotted in grey in (A) for comparison. (B) Predicted chlorine content-dependent apatite and annealing model-dependent zircon mean track length data (MTL) plotted against model ages. (C) Individual particles’ model time-temperature paths extracted from Model B (Fig. 2). Coloured dashed lines in (C) represent the portions of the particles’ time-temperature paths that have changed between Model A (inversion) and Model B (no inversion, pure postrift thermal relaxation). Brown bars indicate the ages of extension in Model B. See Figure 3 for details. |
© S. Ternois et al., Published by EDP Sciences 2021
 This is an Open Access article distributed under the terms of the Creative Commons Attribution License (https://creativecommons.org/licenses/by/4.0), which permits unrestricted use, distribution, and reproduction in any medium, provided the original work is properly cited.
All Figures
|
Fig. 3 Thermochronometric modelling predictions for model of inverted rifted margins (Model A; Fig. 1A). (A) Model thermochronological ages for the four low-temperature thermochronometers considered in this study. Low-temperature thermochronometers are apatite (U-Th)/He (AHe), apatite fission-track (AFT), zircon (U-Th)/He (ZHe) and zircon fission-track (ZFT) systems. Age predictions are plotted as boxplots against particle number and solid black squares represent model mean ages. PD: proximal domain, also margin; ND: necking domain; HE: hyperextended domain; EM: exhumed mantle domain. (B) Predicted chlorine content-dependent apatite and annealing model-dependent zircon mean track length data (MTL) plotted against model ages. Error bars shown for predicted MTL represent the standard deviation SD calculated by the software program QTQt (Gallagher, 2012; v5.7.1) and the colour scheme corresponds to margin domains as in (A) and Figure 1. Circles represent lower plate particles 1–8 and diamonds represent upper plate particles 9–14. For a given domain, colour shade allows differentiating particles from one another (for instance, regarding hyperextended domains, light purple corresponds to particle 6 while dark purple corresponds to particle 8). For each particle, four apatite age-MTL and three zircon age-MTL are predicted, depending on apatite chlorine content range and annealing model tested. In the AFT plot, point size increases with chlorine content. In the ZFT plot, small-sized points correspond to predictions obtained using the Yamada et al. (2007) short-time annealing model while medium-sized points correspond to predictions obtained using the Tagami et al. (1998) model. Large-sized points are indistinguishable as the Yamada et al. (2007) long-time annealing model yields the same results. They are represented in black. (C) Individual particles’ model time-temperature paths extracted from Model A (Figs. 1 and SI01). The colour scheme corresponds to margin domains as in (A) and Figure 1. Each plot represents one type of domain, irrespective of the plate (from bottom to top: exhumed mantle domain, hyperextended domains, necking domains, proximal domains) Ap.: apatite; Zr.: zircon; PAZ: fission-track partial annealing zone; PRZ: helium partial retention zone. Model data in (A) and (B) are generated for each particle through QTQt forward modelling of their individual time-temperature path in (C). Brown bars indicate the ages of extension and transition from extension to convergence in Model A (Fig. 1). |
| In the text | |
|
Fig. 4 Thermochronometric modelling predictions for model of non-inverted, thermally-relaxed rifted margins (Model B; Fig. 2). (A) Model thermochronological ages for the four low-temperature thermochronometers considered in this study. Age patterns predicted for Model A (Fig. 3) are plotted in grey in (A) for comparison. (B) Predicted chlorine content-dependent apatite and annealing model-dependent zircon mean track length data (MTL) plotted against model ages. (C) Individual particles’ model time-temperature paths extracted from Model B (Fig. 2). Coloured dashed lines in (C) represent the portions of the particles’ time-temperature paths that have changed between Model A (inversion) and Model B (no inversion, pure postrift thermal relaxation). Brown bars indicate the ages of extension in Model B. See Figure 3 for details. |
| In the text | |
Current usage metrics show cumulative count of Article Views (full-text article views including HTML views, PDF and ePub downloads, according to the available data) and Abstracts Views on Vision4Press platform.
Data correspond to usage on the plateform after 2015. The current usage metrics is available 48-96 hours after online publication and is updated daily on week days.
Initial download of the metrics may take a while.