")
")
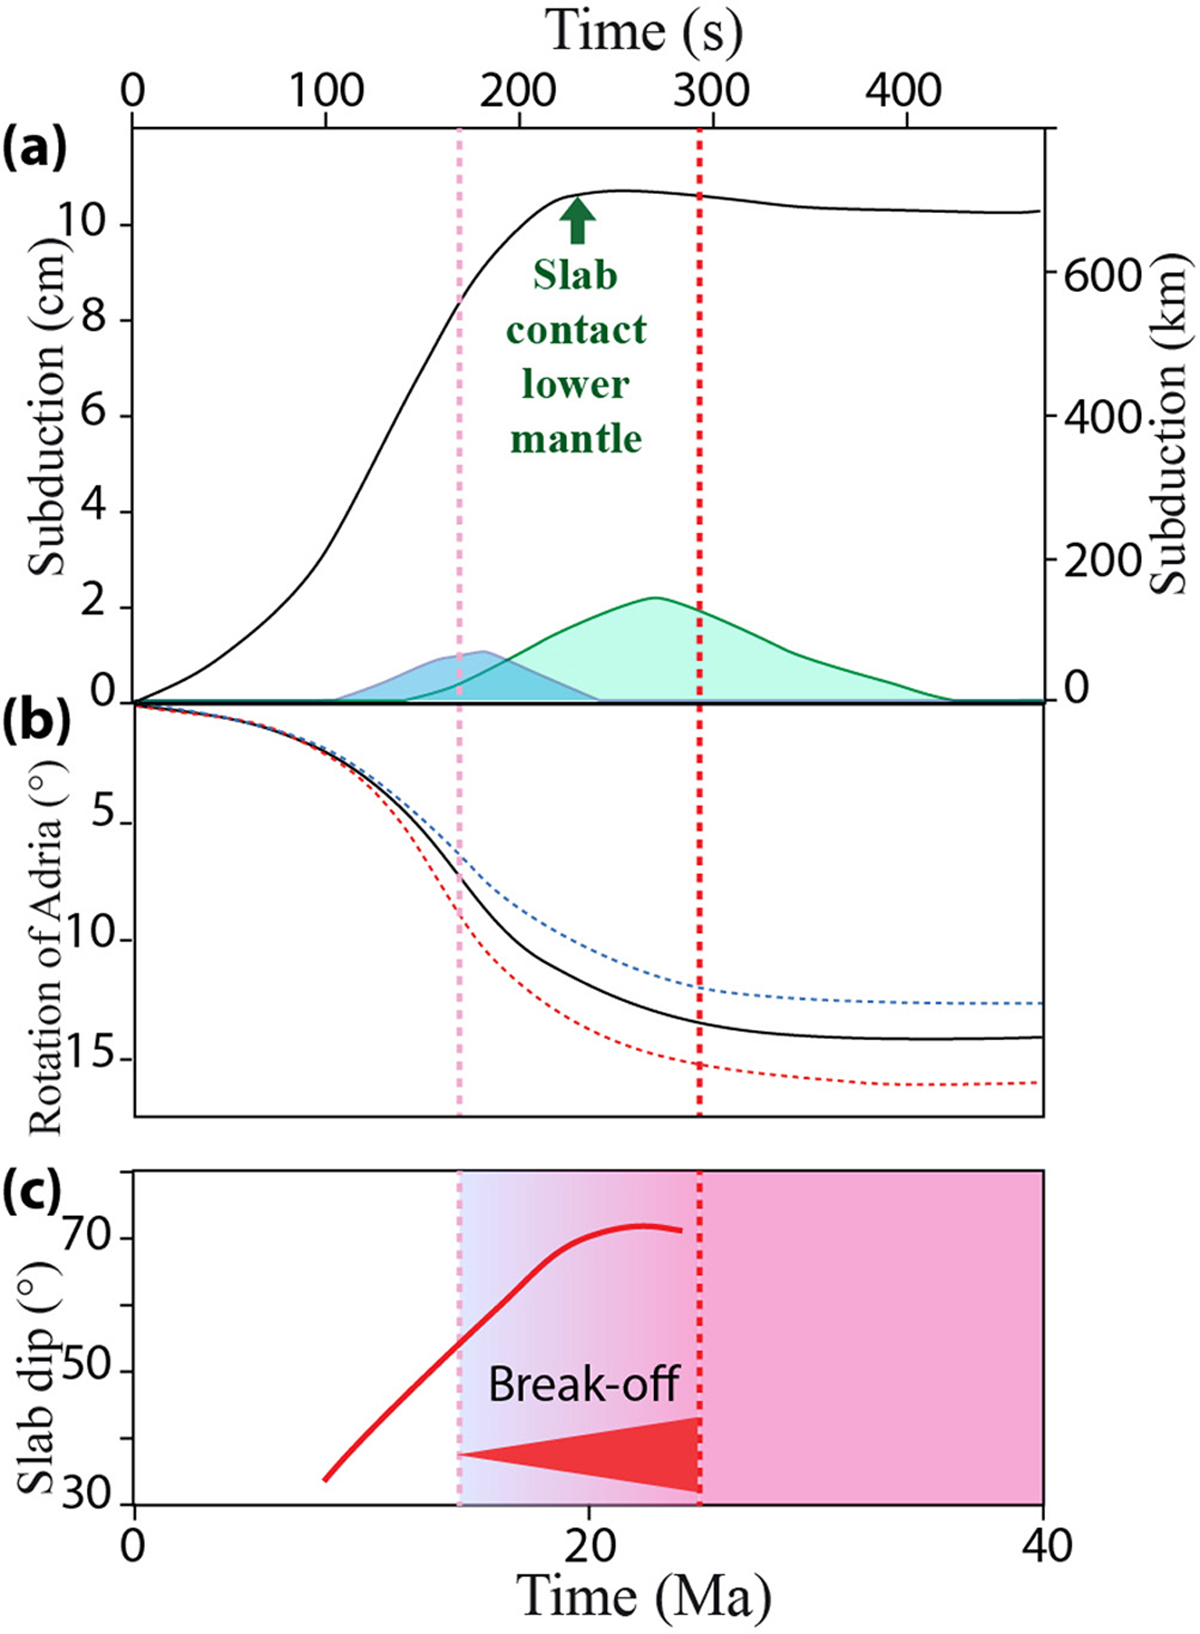
Fig. 6
Download original image
(a) length of subduction (black curve), and length of subducted continent in Adria (blue curve) and Africa (green curve) vs. time, in Model 3. The position of the three sections along which lengths of subduction are measured are visible in Figure 5. In this model, subduction of the continental part of Adria starts earlier than that of Africa. Slab break-off also occurs sooner explaining why the subducted continental plate comes back earlier to the surface. (b) counterclockwise rotation of Adria (black curve = average rotation of the plate; blue and red dotted curves = rotation of northern and southern Adria, respectively). (c) dip of the slab beneath the African margin, and propagation of slab break-off from Adria to Africa, vs. time.
Current usage metrics show cumulative count of Article Views (full-text article views including HTML views, PDF and ePub downloads, according to the available data) and Abstracts Views on Vision4Press platform.
Data correspond to usage on the plateform after 2015. The current usage metrics is available 48-96 hours after online publication and is updated daily on week days.
Initial download of the metrics may take a while.