")
")
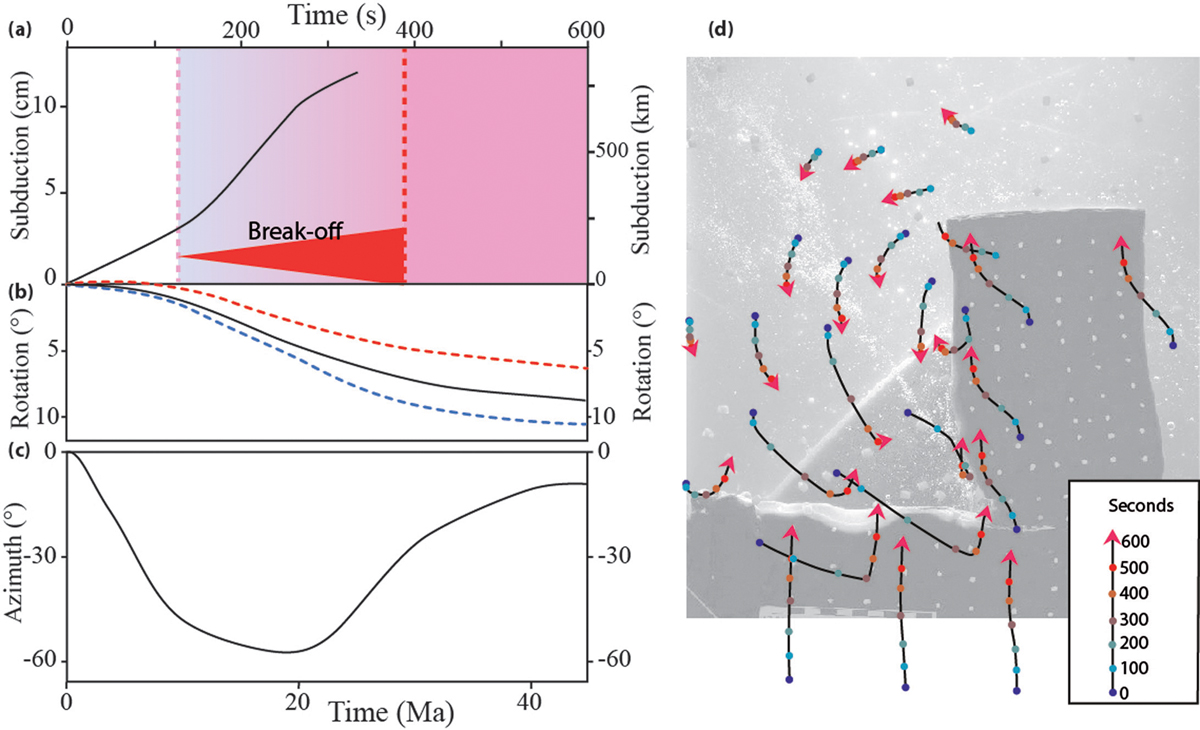
Fig. 9
Download original image
(a) Length of subduction vs. time, in Model 7. Slab break-off initiates after 130 s beneath northern Adria and is complete after 380 s. (b) rotation of Adria vs. time (black curve = average rotation of the plate; blue and red dotted curves = rotation of northern and southern Adria, respectively). (c) azimuth of the motion of northern Adria vs. time. (d) superficial motion path superimposed above the top view at the end of experiment (600s). Note that the motion of Adria shifts to the NW when the subduction is active, before slab break-off.
Current usage metrics show cumulative count of Article Views (full-text article views including HTML views, PDF and ePub downloads, according to the available data) and Abstracts Views on Vision4Press platform.
Data correspond to usage on the plateform after 2015. The current usage metrics is available 48-96 hours after online publication and is updated daily on week days.
Initial download of the metrics may take a while.