")
")
Fig. 11
Download original image
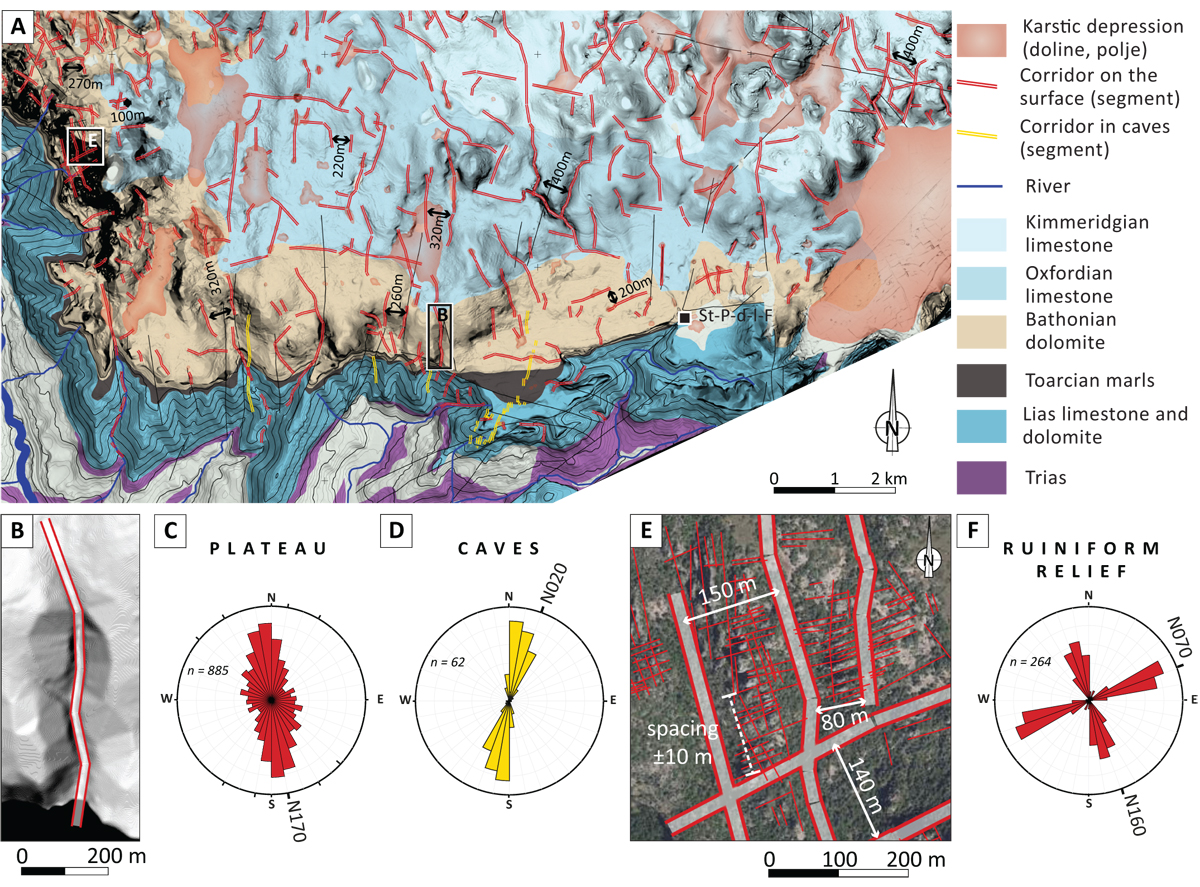
A. Corridors are mapped across a 40km2 surface on the plateau (location shown in Figure 5). To facilitate the visualisation of corridors, the slope digital model overlies the DEM on the plateau area, and contour lines are displayed in the slope. On the plateau, corridors display a 100-m scale spacing. B. Corridors are divided into a series of linear segments defined by their centreline. Corridors express a zig-zag shape and cross-cut each other. C. Approximately 65% of the measured segments on the surface display a N-S direction, with a range of 80° centred around N170. D. Underground corridors are oriented in a N-S direction and are spaced approximately 10 m apart. E. The ruiniform relief zone, in the west of the analysed area, displays corridors with a 10-m scale spacing, set between larger-scale corridors corresponding to the one mapped on the plateau. F. This set of high-frequency corridors follows two orthogonal directions, that are similar to the fracture pattern measured by Barthélémy et al. (1996) on the Larzac plateau.
Current usage metrics show cumulative count of Article Views (full-text article views including HTML views, PDF and ePub downloads, according to the available data) and Abstracts Views on Vision4Press platform.
Data correspond to usage on the plateform after 2015. The current usage metrics is available 48-96 hours after online publication and is updated daily on week days.
Initial download of the metrics may take a while.