


| Issue |
BSGF - Earth Sci. Bull.
Volume 197, 2026
Ressources géothermales et sociétés / Geothermal Resources and Societies
|
|
|---|---|---|
| Article Number | 15 | |
| Number of page(s) | 12 | |
| DOI | https://doi.org/10.1051/bsgf/2026008 | |
| Published online | 22 juillet 2026 | |
Sedimentary hints of seismic reflectors into an oolithic carbonate analogue reservoir study case on the “Oolithe Blanche” (Burgundy, France)
Origines sédimentaires des réflecteurs sismiques dans un analogue de réservoir carbonaté : étude de cas sur l’Oolithe Blanche (Bourgogne, France).
1
IFP Energies nouvelles, 1-4 avenue de Bois-Préau, 92852 Rueil-Malmaison, France
2
ISTO, Université d’Orléans, UMR 7327, Orléans, France
3
Department of Earth Sciences, Utrecht University, Utrecht, the Netherlands
4
GEOSCIENCES, Mines Paris – PSL, Fontainebleau, France
5
Université Paris-Saclay, CNRS, GEOPS, 91405, Orsay, France
6
Institut universitaire de France (IUF), Paris, France
7
Notre Dame University (NDU), Louaize, Lebanon
* Corresponding author: Cette adresse e-mail est protégée contre les robots spammeurs. Vous devez activer le JavaScript pour la visualiser.
Received:
10
December
2025
Accepted:
19
May
2026
Abstract
Although 3D and even 4D seismic imaging have advanced significantly, some acoustic patterns in carbonate reservoirs remain poorly understood. Diagenetic effects are still largely overlooked in interpreting reflectors within these complex sedimentary systems. We present a field study based on an outcrop of a well-known carbonate formation, the “Oolithe Blanche” of the Paris Basin (Burgundy, France). This formation is currently one of the preferred targets for medium enthalpy geothermal exploitation in the Paris Basin. A quarry working face is meshed with a decimetric resolution. Each cell of the grid is characterized from a sedimentological point of view and assigned to a dominant facies. Using a portative device, the 2D section is acoustically investigated by measuring horizontal and vertical P- and S- waves velocities. P-wave velocities measurements contribute to calculate synthetic seismic using a wavelet frequency allowing to highlight reflectors and seismic facies inside the section. Comparison between the synthetic seismic profile and the facies description provides us three main results. Firstly, the study allows us to characterize the acoustic role of the cross-beds visible in two carbonate facies of the site. These structures preferentially accelerate acoustic waves, suggesting lower porosity and permeability in this facies. Secondly, the seismic reflectors align with the boundaries of rudstone facies. The initial lithological contrast is amplified by a firm ground atop the underlying structure, increasing acoustic impedance and enhancing the seismic response beyond that of a simple facies change. Finally, small-scale karst structures have been described and appear to generate a chaotic seismic facies at the outcrop scale.
Résumé
Malgré l'utilisation généralisée de l'imagerie sismique 3D voire 4D pour la caractérisation de réservoirs géologiques, certaines particularités des réservoirs carbonatés sont encore mal comprises d'un point de vue sismique. En particulier, les effets diagénétiques ne sont pas toujours bien pris en compte dans l'interprétation des réflecteurs observés dans ces réservoirs. Nous proposons ici une étude de terrain centrée sur un affleurement typique d'une formation carbonatée bien connue, l’« Oolithe Blanche » du Bassin Parisien. Cette formation est actuellement l'une des cibles privilégiées pour l'exploitation géothermique à moyenne enthalpie dans le bassin, avec de nombreux doublets implantés dans les métropoles d’Ile-de-France. Le site d’étude se situe en Bourgogne, dans une carrière près du village de Massangis. Un maillage de résolution décimétrique a été dessiné sur un des fronts de taille abandonnés de la carrière. Chaque cellule de la grille est caractérisée d'un point de vue sédimentologique et se voit attribuer un faciès dominant. A l'aide d'un oscilloscope portatif, la coupe 2D a été étudiée acoustiquement en mesurant les vitesses horizontales et verticales des ondes P et S. Une sismique synthétique est ensuite calculée à partir des vitesses des ondes P et en utilisant une ondelette de fréquence centrale adaptée aux dimensions de la coupe. Trois résultats majeurs ont émergé de la comparaison entre la description des faciès et le profil sismique. Premièrement, notre étude a permis de caractériser le rôle acoustique des litages obliques visibles dans deux faciès carbonatés du site. Ces structures apparaissent comme des zones de vitesses rapides des ondes acoustiques, donc potentiellement des zones moins poreuses et moins perméables. D'autre part, les réflecteurs sismiques observés sur la coupe correspondent aux limites d'un faciès particulier, celui à texture rudstone. Le contraste lithologique initial induisant un réflecteur sismique est renforcé par la présence d'une surface partiellement indurée et bioturbée lors de la sédimentation (firm ground) interprétée au sommet de la structure sous-jacente. Cette surface indurée permettrait d'augmenter localement les impédances acoustiques et donc de créer un contraste encore plus fort que le simple changement de faciès. Enfin, des structures karstiques à petite échelle ont été décrites et semblent générer un faciès sismique chaotique à l'échelle de l'affleurement.
Key words: Carbonate / seismic / reflector / facies / field acoustic measurements
Mots clés : carbonates / faciès / réflecteurs sismiques / mesures acoustiques
© M. Adelinet et al., Published by EDP Sciences 2026
 This is an Open Access article distributed under the terms of the Creative Commons Attribution License (https://creativecommons.org/licenses/by/4.0), which permits unrestricted use, distribution, and reproduction in any medium, provided the original work is properly cited.
1 Introduction
The role of carbonate reservoirs in the energy transition is now evolving from hydrocarbon extraction to sustainable geothermal production and storage applications. Indeed, beyond the fact that carbonate reservoirs account for at least 50% of conventional petroleum reservoirs (Burchette, 2012), they are gaining importance in energy diversification strategy. With the rise of carbon capture and storage (CCS) and hydrogen storage, carbonate formations are then being investigated for their ability to safely store fluids over long geological timescales. For instance, depleted North Sea chalk reservoirs are explored for hydrogen storage due to their high porosity and structural trapping potential (Saeed et al., 2023). Carbonate reservoirs are also preferential targets for geothermal energy production. Some fractured carbonate geothermal reservoirs are well-known for high-enthalpy geothermal heating and power generation, such as the Molasse Basin in Germany (Böhm et al., 2010) or the Larderello geothermal field in Italy (Brogi and Liotta, 2008). In France, the Paris Basin hosted the Bathonian “Oolithe Blanche” limestones which are exploited for mid-enthalpy geothermal heating around Paris (Lopez et al., 2010). The Paris region hosts the world’s concentration of mid- enthalpy geothermal heating network production units, with about 50 geothermal heating units currently extracting geothermal water from these Bathonian limestones (Lund and Toth, 2021; Thomas et al., 2023).
As seismic methods remain key tools to characterize carbonate reservoirs whatever their using, understanding their seismic characteristics in term of sedimentary heterogeneities is critical for optimizing exploration and development strategies. Combining various geophysical methods can lead to a more comprehensive understanding of carbonate reservoirs. Seismic inversion is especially useful to delineate reservoir geometry and facies variations within carbonate platforms (Lanteaume et al., 2018; Bashir et al., 2021; Teillet et al., 2021). The depositional context of carbonates is complexified by the introduction of other factors brought by diagenesis processes (cementation, dissolution, karstification, hard or firm ground development . . .). Then, understanding how seismic reflections correspond to geological features in carbonate reservoirs is fundamental because they could be independent from age deposit. All the diagenetic stages affect acoustic properties (Adelinet et al., 2019; Bailly et al., 2019a) and obviously seismic data interpretation (Eberli et al., 2004; Embry et al., 2021; Liu et al., 2011). Hendry et al. (2021) provides an in-depth analysis of how depositional and diagenetic processes influence seismic responses in carbonate settings. It emphasizes the challenges posed by the heterogeneity of carbonate rocks and the impact of diagenetic alterations on acoustic properties.
Calibrating sedimentological features with synthetic seismic interpretation at the outcrop scale enhances the understanding of subsurface structures. On carbonate platforms located on the Northern part of Lebanon we have demonstrated the validity of this approach by combining sedimentological description with physical property measurement to tie with onshore seismic data acquired in the area (Abbani et al., 2023). In all the diagenetic processes which affect the microstructure of carbonate reservoirs, the karstification can significantly alter the porosity and permeability and thus affects seismic imaging significantly (Fournillon et al., 2021). It highlights the importance of integrating seismic data with geological and petrophysical information to accurately identify and characterize karstified zones (Burberry et al., 2016).
As mentioned above, due to a lot of factors, the pore systems in carbonate reservoirs can be very complex at different scales. This complexity can have adverse effects on the efficiency of reservoir production (Grishchenko et al., 2022). Combining outcrop data and forward seismic models appears to be crucial to improve seismic predictions and geological modeling (Sarg et al., 2003; Lanteaume et al., 2018; Teillet et al., 2021). We propose here to use outcrop acoustic measurement and sedimentological characterization to shed new light on the subject. This paper focuses on one analog outcrop of the Bathonian “Oolithe Blanche” reservoir which is targeted in the Paris Basin for geothermal production. The idea is to demonstrate how sedimentary features can serve as indicators for seismic reflectors in oolitic carbonate reservoirs.
2 Material and methods
2.1 2D section in the “Roche de Valanges” quarry face
Our study takes place in the Vaurion quarry operated by POLYCOR, near to the village of Massangis (Burgandy, France) located in the south-eastern part of the Paris Basin (Fig. 1). Outcropping rocks are limestones from Late Bathonian age (around 167 Ma, Mid-Jurassic) producing building stones for outdoor and indoor applications (De Kock et al., 2012).
Based on previous studies (Casteleyn et al., 2010; Thomas et al., 2021; Vincent et al., 2021), three main type of limestones are identified on the different working faces of the quarry (Fig. 2B), from the base to the top: 1) the “roche de Valanges”, 2) the “roche de Massangis” and 3) the Comblanchien Limestone. “Roche de Valanges” and “roche de Massangis” are two members belonging to the “Oolithe Blanche” Formation, aged from Early to Late Bathonian. The Comblanchien limestone is a lithostratigraphic formation dating from the Late Bathonian. Our study focuses on the “roche de Valanges”, which is called simply Valanges member (mb.) in the continuation of the article.
Our investigations have been carried out on a brand-new quarry face dug in 2021 (Figs. 2A and 2B). A complete 2D section was meshed directly on the outcrop over an area of about 12 m wide by 2.8 m high. On this surface, 403 nodes are marked, with 20 cm height and 40 cm horizontal spacing (Fig. 2C).
 |
Fig. 1 Location maps. A: geographical footprint of the Paris basin (Google Earth map background). B: Geological map of the Paris Basin (extract from 1:1 million scale geological map of metropolitan France – BRGM). |
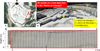 |
Fig. 2 Location of the study. A: Google Earth view of the Vaurion quarry. B : Extract of the 3D model made by GEOPS from photogrammetric data with the three types of limestones (Thomas et al., 2021). C: gridding of the 2D section in the new Valanges outcrop. |
2.2 Sedimentary description
A first definition of the outcropping facies into the Valanges mb. is directly derived from Thomas et al. (2021). It corresponds to the Low Resolution (LR) facies on Table 1. The three exhibited facies, noted F2a-F2b-F2c, correspond to a tidal to sub-tidal association facies: Ooid grainstone with bioturbation (F2a), ooid grainstone with herring-bones (F2b) and bioclastic grainstone to rudstone (F2c). There are grain-supported facies composed with ooids and oncoids (Thomas et al., 2021).
Thanks to the quality of the outcrop provided by the fresh cut in the quarry, we were able to describe new structures in addition to the facies initially recognized. Thus, a new nomenclature is established (high resolution column on Tab. 1) including a description of specific porosity facies (stylolith, karst, vugs). Another diagenetic facies has been defined: the black facies called “firm ground”. A firm ground corresponds to a partially lithified seafloor surface that develops under marine conditions during early diagenesis. On the contrary to fully cemented hard grounds, firm ground can still be penetrated by burrowing organisms. Even if firm ground is developing over a dedicated facies on the section, we assign the facies ”firm ground” to each mesh of the grid with the occurrence of firm ground inside.
Figure 3A displays 4 thin sections from samples taken from the most common facies within the studied 2D outcrop showing rock textures and diagenetic structures that are linked to fluid circulation and mainly dissolution (bioturbated fine grainstone, rudstone, angular cross-bedded grainstone, stylolites and vugs). In addition, Figures 3B and 3C exhibits macro views of bioturbation, perforated and indurated surfaces, which are visible in the Valanges outcrops within the quarry.
Facies definition for the Valanges fm.
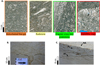 |
Fig. 3 Sedimentological features observed into the Valanges member outcrops. A: Thin sections exhibiting specific facies recognized on the 2D section. B: Bioturbation and bioturbated facies in firm ground. C: Styloliths (st.) under the perforated surface below a hardground (hd.: hardround, p.: bioturbated perforation). |
2.3 Acoustic measurements
In situ acoustic measurements are performed directly on outcrop using a portable acoustic device (PUNDIT PL-200) with 40 kHz S-wave transducers (Figs. 4A and 4B). Volume waves are emitted and recorded in two directions by placing the transmitter on a node and the receiver on an adjacent node, forming either a vertical or horizontal surface path.
Travel times of P-wave and S-wave are deduced from first break picking on the digital oscillograph’s touchscreen (Fig. 4C). Wave velocities are calculated by dividing the travel time by the spacing between sensors. According to the direction of propagation, the spacing between sensors is either 20 cm (vertical measurements) or 40 cm (horizontal measurements). Considering the 40 kHz central frequency of sensors we work with centimetric wavelength (between 3 and 15 cm for velocities in the range of [1200–6000] m/s). The spacing between the sensors is therefore sufficient for the calculated velocity to be consistent with the investigated wavelength. The uncertainty on the velocity measurements is dependent on the first break picking and on the path length measurements. As measurements are performed on perfectly plane quarry faces, the error is relatively small and considered less than 5%. Also, we performed a reciprocical checking of the measurements by swapping the transmitter and receiver sensors. The arrival times were very similar: a difference of less than 2% across the 10 tests carried out.
 |
Fig. 4 Experimental device for the P and S wave velocities measurements performed on outcrops. A: PUNDIT PL-200, B: 40 kHz S-wave sensors (from Proceq© user guide), C: Example of P- and S- waves arrivals for a 30 cm path. |
2.4 Synthetic seismic workflow
Using a dedicated workflow presented on Figure 5, we calculate a 2D synthetic seismic from outcrop velocities. The 2D section displayed in Figure 2C is split into 31 pseudo 1D vertical logs. The synthetic seismic workflow is applied independently on each 1D log using normal reflection assumption.
During the first step of the workflow P-wave acoustic impededances (Z) are calculated from the product of measured P-wave velocities (VP) with density data (ρ) taken equal to the constant value of 2300 kg/m3 to emphasize the weight of VP measurements. Z data are on the same grid as velocities. Then reflection coefficients (RC) are derived from Z using conventional SEG definition:

where the index n corresponds to the top layer according to the spatial grid discretization (maximum of 13 layers, i.e., 12 RC). The critical part of the methodology is to succeed in placing these RC at their right position in time. For this, we define a very fine time grid (sampling time equal to 10 μs) on which we locate the RCs at their corresponding time using the measured velocities as a velocity model and Two-Way Traveltimes. A time sampling of 10 μs corresponds to a sampling frequency of 10 kHz and an estimated Nyquist frequency of 50 kHz that would be compared to the wavelet central frequency to check the antialiasing and undersampling issues.
Indeed, the second step of the workflow corresponds to the convolution of RC trace with a Ricker wavelet in the time domain. Central frequency is chosen according to the spatial scale of our measurements, here 5 kHz. For classical carbonate velocities (3000–5000 m/s), it is corresponding to a metric-decimetric wavelet. Thus, the vertical resolution taken equal to the quarter of the wavelet is around 20 cm which agrees with the spacing between sensors. The dominant period corresponding to the central frequency of 5 kHz is 200 μs. It means that with a 10 μs sampling time, we have about 20 samples per dominant period, that is an adequate value for our study.
As a post-processing step, we convert the seismic section in time into depth using measured velocities as velocity model once again. In the end, we can display the seismic data both in time and in depth corresponding to the investigated outcrop.
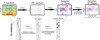 |
Fig. 5 Synthetic seismic workflow used to derive seismic section from outcrop measurements. Z: P-wave impedance, RC: Reflection coefficient, TWT: Two-Way-Traveltime. |
3 Results
3.1 Facies distribution
Figure 6 presents the different facies observed on the outcrop according to the chosen classification explained in the previous section on the facies definition. A dominant pattern has been assigned for each cell. The first bottom layer of the outcrop is made up with the angular crossbed grainstone facies (between 0 and 1 m height) corresponding to low-resolution F2a F2b facies (ooid grainstone). The rudstone facies then forms the second level between 1 and 1.8 m high, which is the same as the F2c facies association. This level appears to be laterally homogeneous in the southern part of the profile over 8 m horizontally but not in the northern part. The firm grounds are located in particular at the level of 1.2 m height and in the southern part of the profile, forming the bottom part of this rudstone level. The karst pattern is also limited to the northern part of the profile on the top of bioturbated grainstone facies. Finally, over the rudstone layer, a third level can be defined between 1.8 m height and the uppermost part of the outcrop (2.6 m height). This level is mainly formed with flat cross bed grainstones (again F2a and F2b low resolution facies).
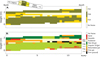 |
Fig. 6 Facies distribution on the 2D section investigated. A: low-resolution facies from (Thomas et al., 2021). B: high-resolution facies defined for the present study. |
3.2 Velocity measurements
The same pair of sensors is used to investigate acoustically the quarry face, both for P-wave and for S-wave propagation. But in some cases, it has been impossible to pick the arrival time of the S-waves (mixed waveforms), which resulted in a greater number of P-wave measurements. Also, some vertical measurements lead to wave velocities that are too slow to be representative of a path in a continuous medium (e.g., presence of stylolites or fractures). Finally, we keep 1032 recorded velocities, split into 329 P-wave horizontal velocities, 304 S-wave horizontal velocities, 231 P-wave vertical velocities and 168 S-wave vertical velocities. Figure 7 displays the results obtained on the 2D section as scatter plots. The horizontal P-wave velocity distribution (Fig. 7A) exhibits clearly a dichotomy on the section: velocities are higher in the bottom part of the section, between 0 and 1 meter height, close to 5000 m/s, whereas the top part of the section exhibits lower velocities around 3500 m/s. We can observe the same tendency on horizontal S velocities and vertical P velocities but in a less marked way.
To emphasize the facies control on the velocities we use violin plots to display P-wave velocities (Fig. 8). It is like box plots with the addition of a probability density of the data smoothed by a kernel density estimator. The main interest is to clearly visualize multimodal data distribution. For instance, the top pictures displayed on Figure 8 shows the vertical variation obtained for F2b facies (cross-bedded grainstone): higher values in the bottom part of the section against lower values in the upper part.
P-wave velocities measured within meshes exhibiting stylolites are anisotropic: horizontal velocities are close to matrix ones (median equal to 4653 m/s), near to the median calculated for sedimentary facies whereas vertical velocities are clearly lower (median equal to 2389 m/s). At this scale, stylolites are mainly planar horizontal objects which explain the discrepancies between horizontal and vertical velocities.
The high-resolution facies scale allows to precise the cross-bed effect. Higher vertical velocities are measured into flat cross-bedded grainstones (median value equal to 4205 m/s against 3650 m/s for the horizontal measurements). On the contrary, the horizontal velocities measured into angular cross-bedded grainstones are higher than the vertical ones measured into the same facies (4318 m/s against 3613 m/s). Based on these two observations, it seems that we can conclude that cross-beds play a role in the structure of carbonates: these structures seem to be zones favoring the propagation of waves.
 |
Fig. 7 Measured 40 kHz velocities. A: Horizontal P-wave velocities. B: Vertical P-wave velocities. C: Horizontal S-wave velocities. D: Vertical S-wave velocities. |
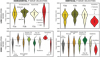 |
Fig. 8 Violin plot for horizontal and vertical P-wave velocities measured on the 2D section. Top: Colors correspond to low-resolution facies scale (Thomas et al., 2021). Bottom: Colors correspond to high-resolution facies scale (present study). Definition of facies are also mentioned around plots. Horizontal dashed lines correspond for top and bottom pictures respectively to the median value for F2b facies (khaki facies) and for Angular cross-bedded (CB) grainstone (light green facies). |
3.3 2D synthetic seismic
Vertical P-wave velocities are used to compute synthetic seismogram using the workflow presented in section 2.4. Figure 9 presents the seismic section in time using an anti-aliased image interpolation. A Hanning interpolation filter was applied to the seismic amplitudes obtained from the synthetic seismic calculation. We use the standard SEG display saying that a sharp increasing impedance with depth is depicted in red, corresponding to a kick. Reversely a decreasing impedance with depth is illustrated with a blue trough. Note the high frequency used for the convolution Ricker wavelet (5 kHz) which allows to distinguish reflectors within the section. The lateral continuity is not obvious except for the part between 0.6 and 0.8 ms.
To better correlate with the sedimentology, we convert the 2D seismic section to depth using the velocities measured on the outcrop. Figure 10 displays both the interpreted high-resolution facies section and the synthetic seismic in depth.
Two main reflectors can be identified, called R1 and R2 on the figure. R1 corresponds to the top of the angular cross-bedded grainstones (light green facies) although R2 seems to mark the top of the rudstones (beige facies). R1 is particularly bright when the top of the formation is formed by a firm ground (indurated surface). In the northern part of the section, we can identify a chaotic seismic facies (CF on the pictures) which is associated with a mixture of facies laterally and vertically, especially the karst pattern.
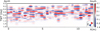 |
Fig. 9 Time synthetic seismic using measured P-wave vertical velocities. The convolution wavelet is a Ricker signal with a central frequency of 5 kHz. The color scale corresponds to seismic amplitude in the SEG standard. |
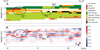 |
Fig. 10 Comparison between HR facies and depth synthetic seismic. A: High-resolution facies section. B: synthetic seismic converted into depth using measured vertical P-wave velocities. CF: Chaotic Facies. R1 and R2: Reflectors. |
4 Discussion
The integration of acoustic measurements and 1D seismic modeling part of the “Oolithe Blanche” formation provides new insights into the seismic expression of sedimentary heterogeneities within an oolitic carbonate reservoir. By correlating measured velocities with sedimentological facies, three main factors emerge as key controls on seismic response: (1) the influence of cross-bedded grainstones on velocity variations, (2) the role of firm grounds as potential seismic reflectors, and (3) the impact of karstification on chaotic seismic facies.
4.1 Cross-bedded grainstones and velocity anomalies
We have seen previously that the angular cross beds seem to accelerate the acoustic waves into carbonates. By extrapolation, if we consider that high velocity zones are associated with drastic reductions in porosity and therefore permeability, these structures could constitute barriers to fluid flow. This finding may add to the petrophysical studies of clinoform geobodies in carbonates highlighted in Thomas et al. (2021). Different physical behaviors could explain this impact on acoustic properties. Firstly, in cross-bed structure, grains are packed and spatially reorganized. Secondly, local cementation processes can happen around the grain and lead to a matrix mechanical strengthening.
4.2 Firm grounds as seismic reflectors
In our study firm grounds are located on the top of the angular cross bed grainstone facies. Figure 10 shows that the presence of this indurated surface reinforces the seismic reflector located at the grainstone - rudstone boundary. This reflector is a kick, indicating an increase in velocity with depth. Thus, the indurated surface of the firm ground further increases the velocity contrast between the 2 carbonate facies in contact. The early diagenesis process leading to the development of firm grounds (and obviously by extension to hard grounds) include partial cementation and poral space reduction, such as already demonstrated by (Bailly et al., 2019a). Figure 11 displays the diagenetic effect of firm ground over the angular cross-bedded grainstone facies. At the base of the section, the initial intergranular porosity was preserved leading to a collapsed structure due to compaction. On the contrary, near to the firm ground, the intergranular porosity is cemented facilitating the propagation of elastic waves. All this helps to enhance the impedance contrasts into the hosted carbonate facies (here the cross-beded grainstone). Firm grounds and hard grounds can then be tracked by seismic markers in some specific diagenetic context.
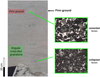 |
Fig. 11 Diagenetic effect of firm ground over grainstone microstructure: A) Field photograph showing the basal part of the 2D outcrop with angular cross-bedded grainstone overlain by an interpreted firm ground; B) PPL photomicrograph of the cemented grainstone facies below firm ground; and C) PPL photomicrograph representing the less cemented grainstones of the angular cross-bedded grainstone showing further compacted textures during later burial. |
4.3 Karst-induced chaotic seismic facies
Figure 10 provides evidence of chaotic seismic facies in the northern part of the profile. This seismic facies is concomitant with the presence of small-sacle karst at the outcrop. It means that small-scale horizontal dissolution features have been observed at this level. It corresponds to localized diagenetic processes leading to discrete vugs or small cavities linked all together with planar structures which affect porosity and permeability at the grain scale. The small cavities can occasionally collapse and become filled with fine material (Fig. 12). Dissolution and collapse structures can generate high-variance acoustic responses, challenging the interpretation of the results. At a larger scale, it has been demonstrated that karst structures could induce chaotic seismic facies (Eberli et al., 2004; Fournillon et al., 2021; Salman et al., 2024). The explanation could be linked with the drastic porosity variation into the karstic features and the fact that the karstified areas have irregular boundaries resulting in diffuse reflections or multiple seismic events.
All these results and interpolations must be taken with caution, as we have very little information about the change in scale. Our data was acquired at the spatial scale of the outcrop using high-frequency sensors. The interpretations and translations we have made concern the seismic scale, where the seismic bin is of the order of ten meters and the emitting source of the order of ten Hertz. It has been shown that velocities in carbonates are obviously affected by changes in scale, whether spatial or frequency, Bailly et al. (2019b; 2024) have successfully demonstrated this key issue on Eocene lacustrine carbonates from Samos Island (Greece) at the outcrop scale. On a larger scale, Fournillon et al. (2021) provide a very interesting study on seismic signature of karst features over carbonate build-ups from South-East Asia dataset, using seismic modeling workflow applied at field seismic scale.
 |
Fig. 12 Field photographs indicating the evidence of microkarst and carbonate dissolution features on the Vallange mb. Outcrop. Gst: grainstone. |
5 Conclusion
This study highlights the complex relationship between sedimentological facies and seismic response in carbonate reservoirs, with a focus on a part of the the “Oolithe Blanche” formation which can be considered as an outcropping analogue to the Dogger geothermal aquifer targeted in the Paris Basin. Through the integration of high-resolution acoustic measurements and 1D seismic modeling, this research provides new insights into the seismic expression of carbonate rock heterogeneities. The results show that some sedimentary features, such as facies (cross-bedded grainstones vs. rudstone for instance), primary sedimentary syructures (e.g., firm grounds), and diagenetic patterns (cementation, karstification) play key roles in shaping acoustic signatures.
The cross-bedded grainstone facies exhibits higher velocities than expected, likely due to the preferential cementation and grain packing, resulting in impedance leading to a positive seismic reflector. When firm grounds are present at the top of this facies, the seismic reflector is enhanced with a stronger impedance contrast. On the contrary, karstification produces chaotic seismic facies, due to the dissolution and collapse of carbonate rock, leading to irregular porosity and impedance variations. These findings reinforce the importance of considering both sedimentary structures and diagenetic features when interpreting seismic data from carbonate or clastic rocks.
The transition from high-resolution measurements to real seismic data requires careful consideration of upscaling techniques and the integration of additional geological data to achieve more accurate subsurface models. Our results underscore the need for further research into the quantification of seismic attributes associated with carbonate heterogeneities and the development of better tools to bridge the gap between different scales of measurement. Nevertheless, the integration of sedimentological data with seismic interpretation remains an essential approach in advancing the understanding of carbonate reservoirs in both exploration and production settings.
Ackowledgments
We specially thank Bertrand Chaume and POLYCOR for providing us the access to the quarry and the logistic support for our study. We sincerely thank the two anonymous reviewers who helped us to improve the manuscript.
References
- Abbani G, Adelinet M, Inati L, Bailly C, Nader F. 2023. Seismic characterization of Cenomanian–Turonian carbonate platform based on sedimentological and geophysical investigation of onshore analogue outcrop (northern Lebanon). Geophys Prospect 71(8): 1616–1632. [Google Scholar]
- Adelinet M, Barthélémy JF, Bemer E, Hamon Y. 2019. Effective medium modeling of diagenesis impact on the petroacoustic properties of carbonate rocks. Geophysics 84(4): WA43–WA57. [Google Scholar]
- Bailly C, Adelinet M, Hamon Y, Fortin J. 2019a. Combined controls of sedimentology and diagenesis on seismic properties in lacustrine and palustrine carbonates (Upper Miocene, Samos Island, Greece). Geophys J Int 219(2): 1300–1315. [Google Scholar]
- Bailly C, Fortin J, Adelinet M, Hamon Y. 2019b. Upscaling of elastic properties in carbonates: a modeling approach based on a multiscale geophysical data set. J Geophys Res: Solid Earth 124(12): 13021–13038. [Google Scholar]
- Bailly C, Léger E, Andrieu S, Regnet JB, Bergogne M, Monvoisin G, et al. 2024. Behavior of elastic properties in carbonates: scale does matter. In: EGU General Assembly Conference Abstracts (p. 12400). [Google Scholar]
- Bashir Y, Faisal MA, Biswas A, Babasafari AA, Ali SH, Imran QS, et al. 2021. Seismic expression of miocene carbonate platform and reservoir characterization through geophysical approach: application in central Luconia, offshore Malaysia. J Pet Explor Prod Technol 11: 1533–1544. [Google Scholar]
- Böhm F, et al. 2010. Deep geothermal energy production from the Bavarian Molasse Basin. Geothermics 39(2): 131–146. [Google Scholar]
- Brogi A, Liotta D. 2008. Geothermal implications of carbonate reservoirs in Italy. J Struct Geol 30(8): 1067–1080. [Google Scholar]
- Burberry CM, Jackson CAL, Chandler SR. 2016. Seismic reflection imaging of karst in the Persian Gulf: implications for the characterization of carbonate reservoirs. AAPG Bull 100(10): 1561–1584. [Google Scholar]
- Burchette TP. 2012. Carbonate rocks and petroleum reservoirs: a geological perspective from the industry. Geol Soc London Spec Publ 370(1): 1–57. [Google Scholar]
- Casteleyn L, Robion P, Collin PY, Menéndez B, David C, Desaubliaux G, et al. 2010. Interrelations of the petrophysical, sedimentological and microstructural properties of the Oolithe Blanche Formation (Bathonian, saline aquifer of the Paris Basin). Sediment Geol 230(3-4): 123–138. [Google Scholar]
- De Kock T, Boone M, Dewanckele J, De Boever W, Vandevoorde D, Boone M, et al. 2012. Monitoring frost susceptibility of limestone facies. In: 12 International conference on the Deterioration and Conservation of Stone. [Google Scholar]
- Eberli GP, Masaferro JL, Sarg JF. (Eds.). 2004. Seismic Imaging of Carbonate Reservoirs and Systems: AAPG Memoir 81(No. 81). Aapg. [Google Scholar]
- Embry JC, Hunt DW, Colpaert A, Dræge A, Zahm L. 2021. Seismic facies, stratigraphy, geomorphology, and seismic modelling of a Lower Cretaceous carbonate platform. Geol Soc London Spec Publ 509(1): 89–104. [Google Scholar]
- Fournillon A, Fournier F, Vidal O. 2021. Seismic expression of carbonate build-up karstification: Karst modelling strategies and insights from synthetic seismic. Geol Soc London Spec Publ 509: 227–244. [Google Scholar]
- Grishchenko VA, Mukhametshin VS, Rabaev RU. 2022. Geological structure features of carbonate formations and their impact on the efficiency of developing hydrocarbon deposits. Energies 15(23): 9002. [Google Scholar]
- Hendry J, Burgess P, Hunt D, Janson X, Zampetti V. 2021. Seismic characterization of carbonate platforms and reservoirs: an introduction and review. Geol Soc London Spec Publ 509(1): 1–28. [Google Scholar]
- Lanteaume C, Fournier F, Pellerin M, Borgomano J. 2018. Testing geologic assumptions and scenarios in carbonate exploration: insights from integrated stratigraphic, diagenetic, and seismic forward modeling. The Leading Edge 37(9): 672–680. [Google Scholar]
- Liu L, Sun SZ, Yang H, Han J, Gao H, Jing B, et al. 2011. Seismic attributes and integrated prediction of fractured and caved carbonate reservoirs in the Tarim Basin, China. Pet Sci 8(4): 455–461. [Google Scholar]
- Lopez S, Hamm V, Le Brun M, Schaper L, Boissier F, Cotiche C, et al. 2010. 40 years of Dogger aquifer management in Ile-de-France, Paris Basin, France. Geothermics 39(4): 339–356. [Google Scholar]
- Lund JW, Toth AN. 2021. Direct utilization of geothermal energy 2020 worldwide review. Geothermics 90: 101915. [CrossRef] [Google Scholar]
- Saeed M, Jadhawar P, Bagala S. 2023. Geochemical effects on storage gases and reservoir rock during underground hydrogen storage: a depleted North Sea oil reservoir case study. Hydrogen 4(2): 323–337. [Google Scholar]
- Salman NFI, Elsaadany M, Latiff AHA. 2024. Karst geomorphology analysis for geohazard assessment via seismic relief and dip attributes in Jx carbonate field, Central Luconia Province, Malaysia. Bull Geol Soc Malaysia 78. [Google Scholar]
- Sarg JR, Schuelke JS. 2003. Integrated seismic analysis of carbonate reservoirs: from the framework to the volume attributes. The Leading Edge 22(7): 640–645. [Google Scholar]
- Teillet T, Fournier F, Zhao L, Borgomano J, Hong F. 2021. Geophysical pore type inversion in carbonate reservoir: integration of cores, well logs, and seismic data (Yadana field, offshore Myanmar). Geophysics 86(3): B149–B164. [CrossRef] [Google Scholar]
- Thomas H, Brigaud B, Blaise T, Saint-Bezar B, Zordan E, Zeyen H, et al. 2021. Contribution of drone photogrammetry to 3D outcrop modeling of facies, porosity, and permeability heterogeneities in carbonate reservoirs (Paris Basin, Middle Jurassic). Mar Pet Geol 123: 104772. [Google Scholar]
- Thomas H, Brigaud B, Blaise T, Zordan E, Zeyen H, Catinat M, et al. 2023. Upscaling of geological properties in a world-class carbonate geothermal system in France: from core scale to 3D regional reservoir dimensions. Geothermics 112: 102719. [Google Scholar]
- Vincent B, Brigaud B, Thomas H, Gaumet F. 2021. Giant subaqueous carbonate dunes: a revised interpretation of large-scale oo-bioclastic clinoforms in the middle Jurassic of the Paris Basin and its implications. Facies 67(2): 1–28. [Google Scholar]
Cite this article as: Adelinet M, Abbani G, Nader F.H, Brigaud B, Inati L. 2026. Sedimentary hints of seismic reflectors into an oolithic carbonate analogue reservoir study case on the “Oolithe Blanche” (Burgundy, France), BSGF - Earth Sciences Bulletin 197: 15. https://doi.org/10.1051/bsgf/2026008
All Tables
All Figures
|
Fig. 1 Location maps. A: geographical footprint of the Paris basin (Google Earth map background). B: Geological map of the Paris Basin (extract from 1:1 million scale geological map of metropolitan France – BRGM). |
| In the text | |
|
Fig. 2 Location of the study. A: Google Earth view of the Vaurion quarry. B : Extract of the 3D model made by GEOPS from photogrammetric data with the three types of limestones (Thomas et al., 2021). C: gridding of the 2D section in the new Valanges outcrop. |
| In the text | |
|
Fig. 3 Sedimentological features observed into the Valanges member outcrops. A: Thin sections exhibiting specific facies recognized on the 2D section. B: Bioturbation and bioturbated facies in firm ground. C: Styloliths (st.) under the perforated surface below a hardground (hd.: hardround, p.: bioturbated perforation). |
| In the text | |
|
Fig. 4 Experimental device for the P and S wave velocities measurements performed on outcrops. A: PUNDIT PL-200, B: 40 kHz S-wave sensors (from Proceq© user guide), C: Example of P- and S- waves arrivals for a 30 cm path. |
| In the text | |
|
Fig. 5 Synthetic seismic workflow used to derive seismic section from outcrop measurements. Z: P-wave impedance, RC: Reflection coefficient, TWT: Two-Way-Traveltime. |
| In the text | |
|
Fig. 6 Facies distribution on the 2D section investigated. A: low-resolution facies from (Thomas et al., 2021). B: high-resolution facies defined for the present study. |
| In the text | |
|
Fig. 7 Measured 40 kHz velocities. A: Horizontal P-wave velocities. B: Vertical P-wave velocities. C: Horizontal S-wave velocities. D: Vertical S-wave velocities. |
| In the text | |
|
Fig. 8 Violin plot for horizontal and vertical P-wave velocities measured on the 2D section. Top: Colors correspond to low-resolution facies scale (Thomas et al., 2021). Bottom: Colors correspond to high-resolution facies scale (present study). Definition of facies are also mentioned around plots. Horizontal dashed lines correspond for top and bottom pictures respectively to the median value for F2b facies (khaki facies) and for Angular cross-bedded (CB) grainstone (light green facies). |
| In the text | |
|
Fig. 9 Time synthetic seismic using measured P-wave vertical velocities. The convolution wavelet is a Ricker signal with a central frequency of 5 kHz. The color scale corresponds to seismic amplitude in the SEG standard. |
| In the text | |
|
Fig. 10 Comparison between HR facies and depth synthetic seismic. A: High-resolution facies section. B: synthetic seismic converted into depth using measured vertical P-wave velocities. CF: Chaotic Facies. R1 and R2: Reflectors. |
| In the text | |
|
Fig. 11 Diagenetic effect of firm ground over grainstone microstructure: A) Field photograph showing the basal part of the 2D outcrop with angular cross-bedded grainstone overlain by an interpreted firm ground; B) PPL photomicrograph of the cemented grainstone facies below firm ground; and C) PPL photomicrograph representing the less cemented grainstones of the angular cross-bedded grainstone showing further compacted textures during later burial. |
| In the text | |
|
Fig. 12 Field photographs indicating the evidence of microkarst and carbonate dissolution features on the Vallange mb. Outcrop. Gst: grainstone. |
| In the text | |
Current usage metrics show cumulative count of Article Views (full-text article views including HTML views, PDF and ePub downloads, according to the available data) and Abstracts Views on Vision4Press platform.
Data correspond to usage on the plateform after 2015. The current usage metrics is available 48-96 hours after online publication and is updated daily on week days.
Initial download of the metrics may take a while.