")
")
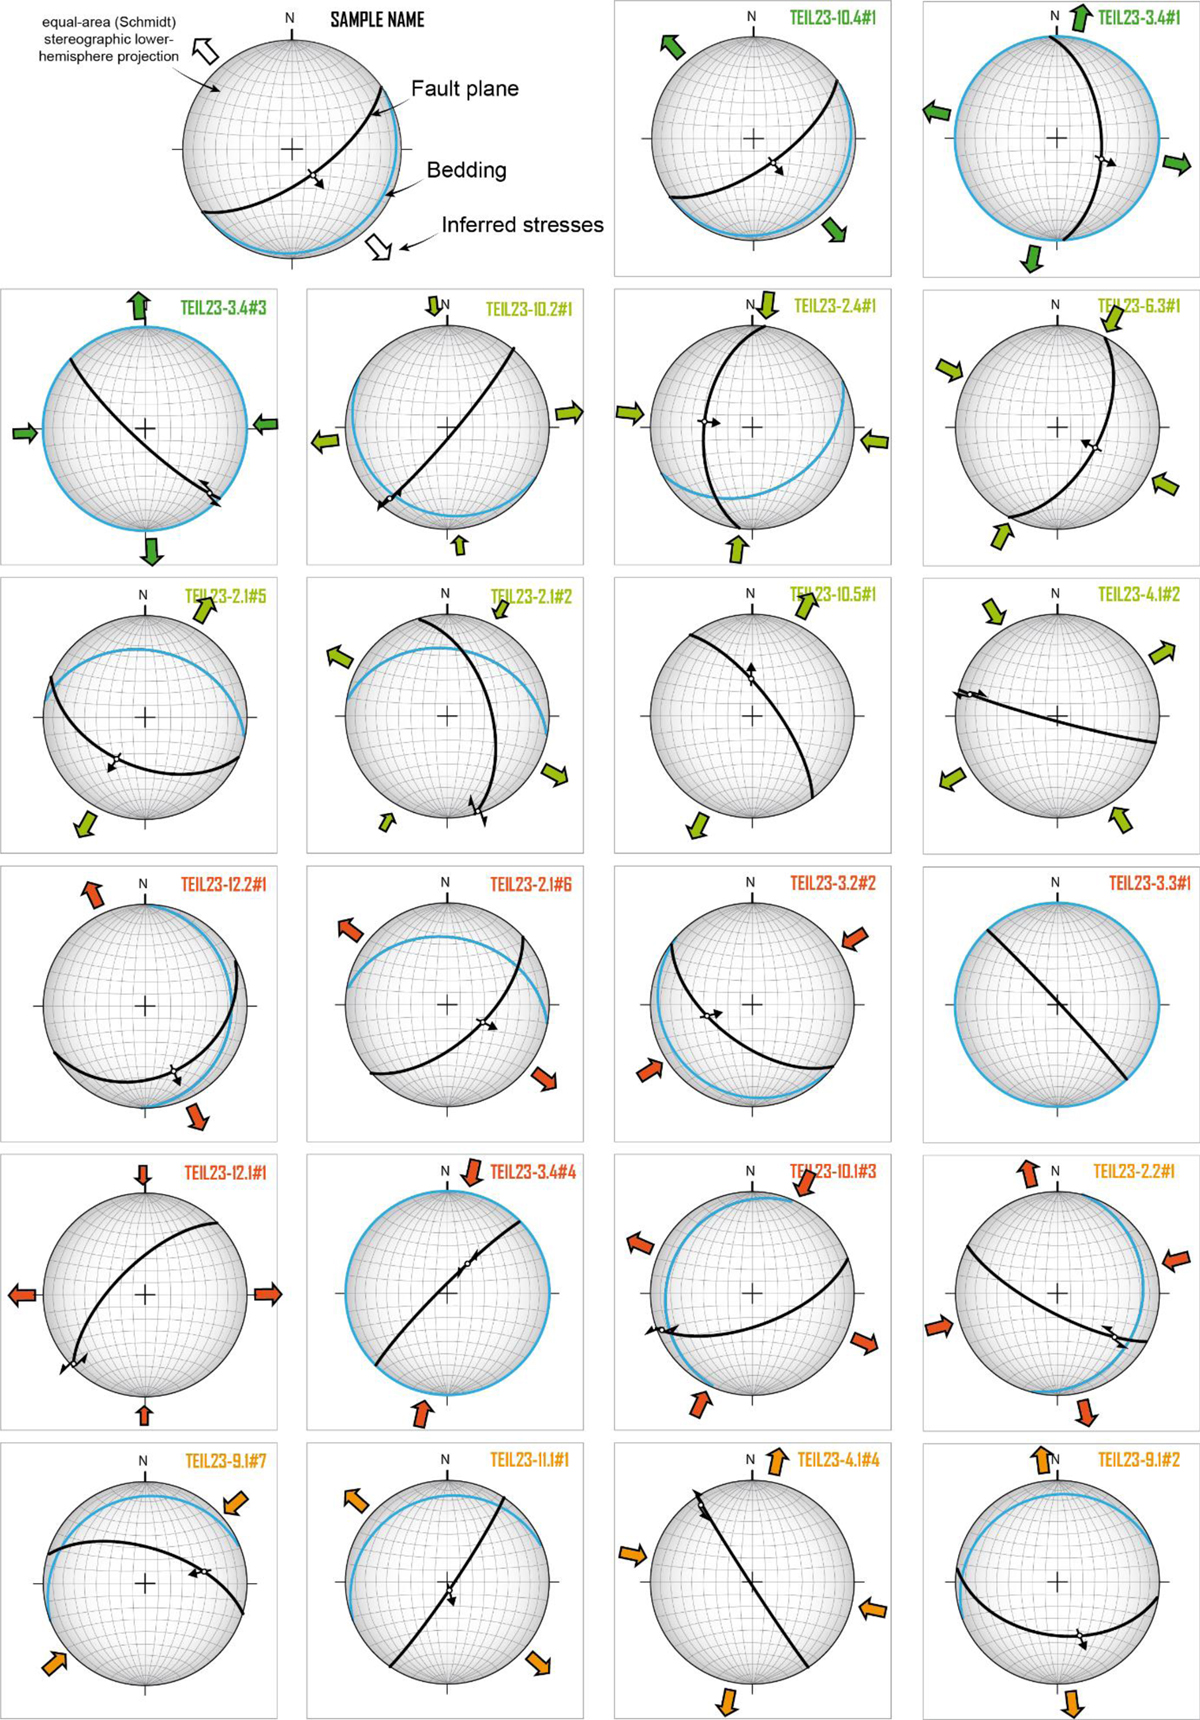
Fig. 3
Download original image
Results of fault planes analysis associated with dated samples. Results are presented on the equal-area (Schmidt) stereographic lower-hemisphere projection and represent the present-day orientation of the fault plane (in black) and the bedding (in blue). State of stress is represented by orange, red, light green or dark green arrows, depending on the U-Pb age of the associated calcite sample.
Les statistiques affichées correspondent au cumul d'une part des vues des résumés de l'article et d'autre part des vues et téléchargements de l'article plein-texte (PDF, Full-HTML, ePub... selon les formats disponibles) sur la platefome Vision4Press.
Les statistiques sont disponibles avec un délai de 48 à 96 heures et sont mises à jour quotidiennement en semaine.
Le chargement des statistiques peut être long.