")
")
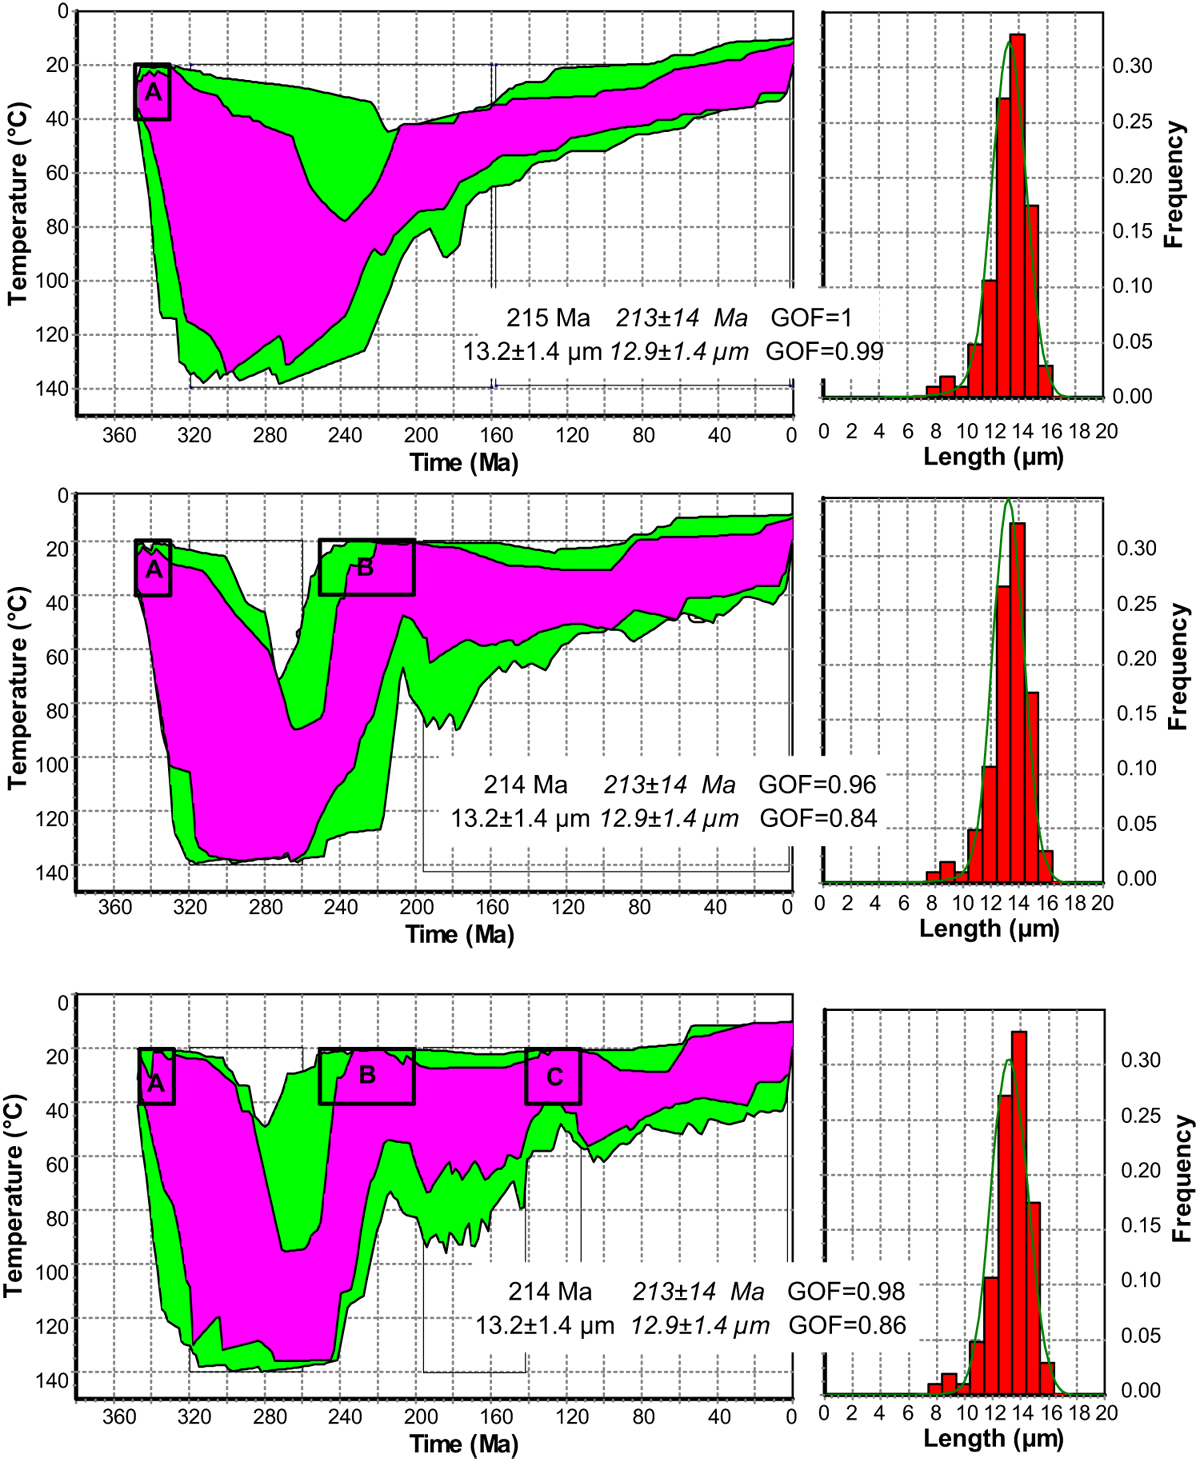
Fig. 5
Download original image
Presentation for sample BEL28 of the different steps of the thermal modelling using AFTSolve®. First step considers only that sample is at surface during the Visean and today. Second step introduced that sample is close to the surface (20–40 °C) during the Triassic. Last step considers that sample is close to the surface also during the Early Cretaceous. Numbers correspond to the measured (in italic) and modeled FT age and mean track length. GOF (goodness of fit) is an indicator of the match between the measured data and the data in agreement with the modeled thermal history (for perfect match, GOF = 1). Histograms correspond to the measured mean confined track length distributions; green lines attached to these histograms correspond to modeled distributions.
Current usage metrics show cumulative count of Article Views (full-text article views including HTML views, PDF and ePub downloads, according to the available data) and Abstracts Views on Vision4Press platform.
Data correspond to usage on the plateform after 2015. The current usage metrics is available 48-96 hours after online publication and is updated daily on week days.
Initial download of the metrics may take a while.