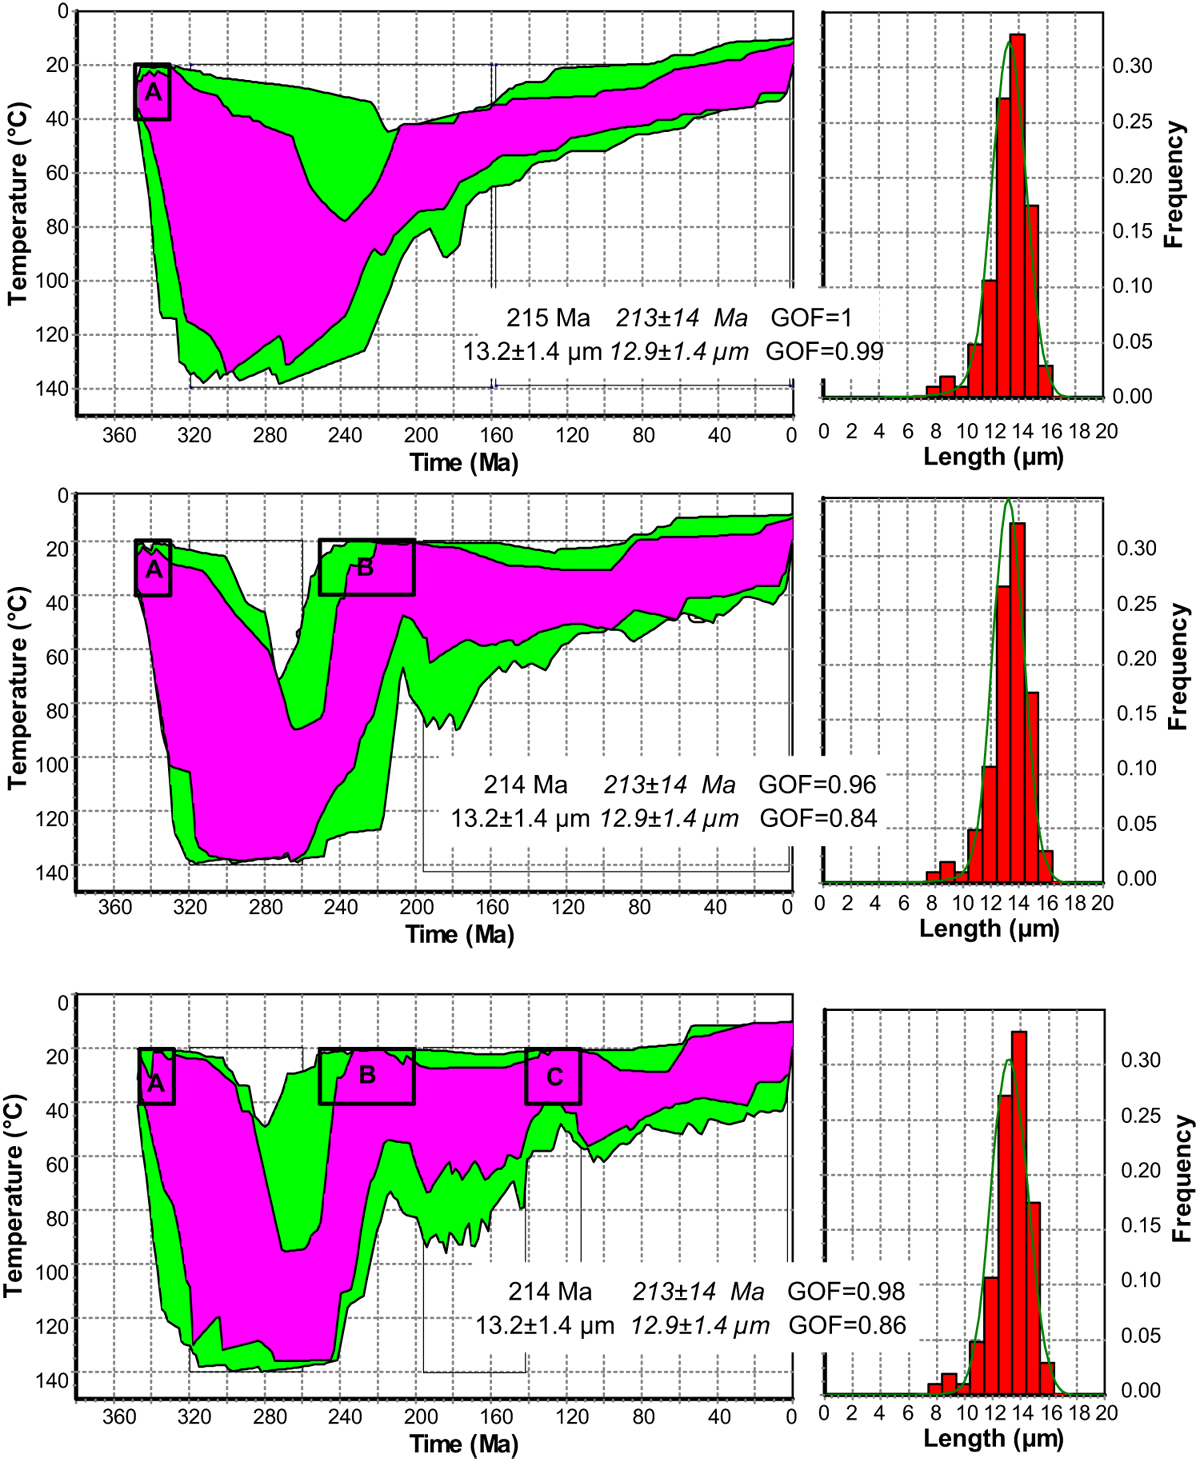
Fig. 5

Download original image
Presentation for sample BEL28 of the different steps of the thermal modelling using AFTSolve®. First step considers only that sample is at surface during the Visean and today. Second step introduced that sample is close to the surface (20–40 °C) during the Triassic. Last step considers that sample is close to the surface also during the Early Cretaceous. Numbers correspond to the measured (in italic) and modeled FT age and mean track length. GOF (goodness of fit) is an indicator of the match between the measured data and the data in agreement with the modeled thermal history (for perfect match, GOF = 1). Histograms correspond to the measured mean confined track length distributions; green lines attached to these histograms correspond to modeled distributions.
Les statistiques affichées correspondent au cumul d'une part des vues des résumés de l'article et d'autre part des vues et téléchargements de l'article plein-texte (PDF, Full-HTML, ePub... selon les formats disponibles) sur la platefome Vision4Press.
Les statistiques sont disponibles avec un délai de 48 à 96 heures et sont mises à jour quotidiennement en semaine.
Le chargement des statistiques peut être long.


