")
")
Open Access
Review
Fig. 8
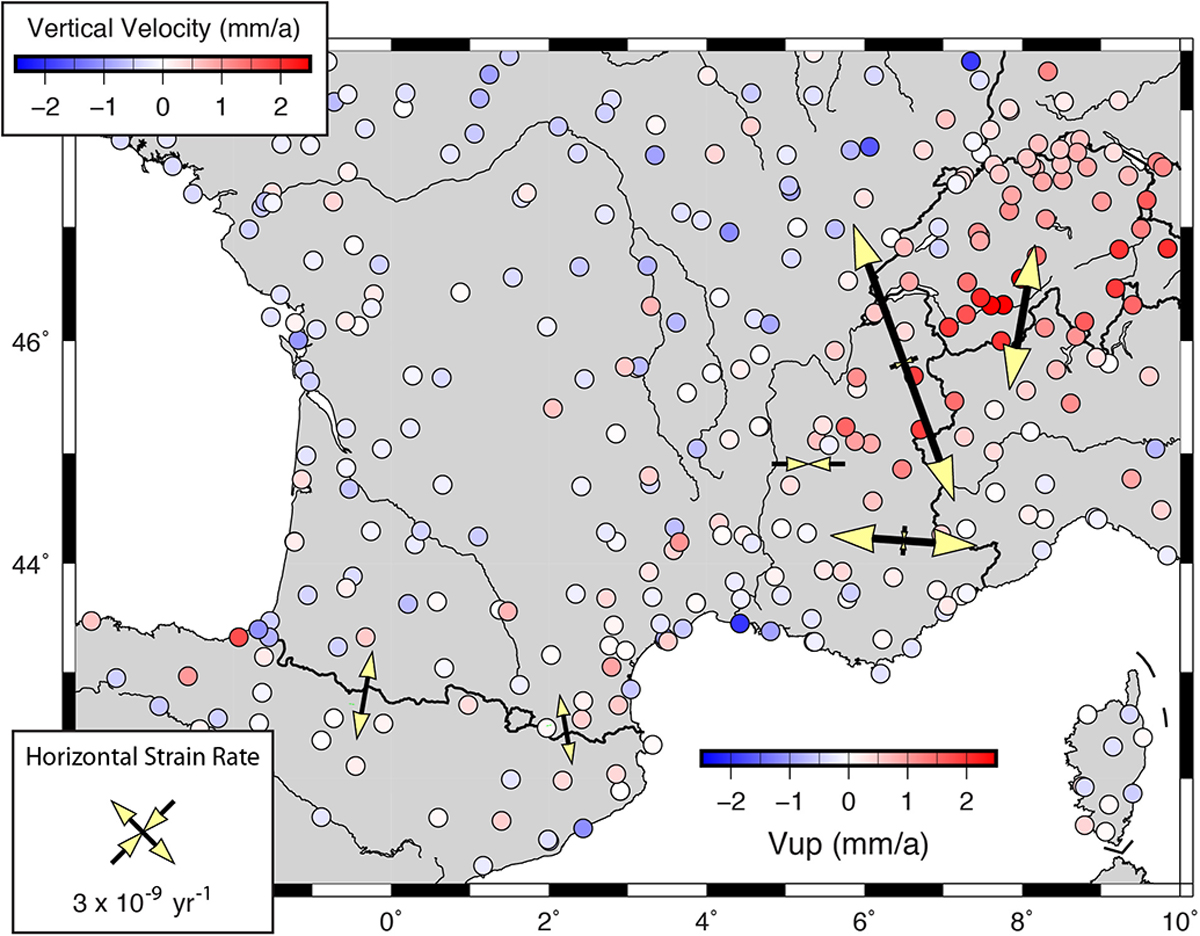
Download original image
GNSS vertical velocities and horizontal strain rates in the Alps and Pyrenees. Colored circles show vertical velocities at GNSS sites (for standard errors smaller 0.25 mm yr−1; Masson et al., 2019b). Yellow and black crosses show horizontal strain rates in the Alps and Pyrenees (cf. text for references).
Current usage metrics show cumulative count of Article Views (full-text article views including HTML views, PDF and ePub downloads, according to the available data) and Abstracts Views on Vision4Press platform.
Data correspond to usage on the plateform after 2015. The current usage metrics is available 48-96 hours after online publication and is updated daily on week days.
Initial download of the metrics may take a while.