")
")
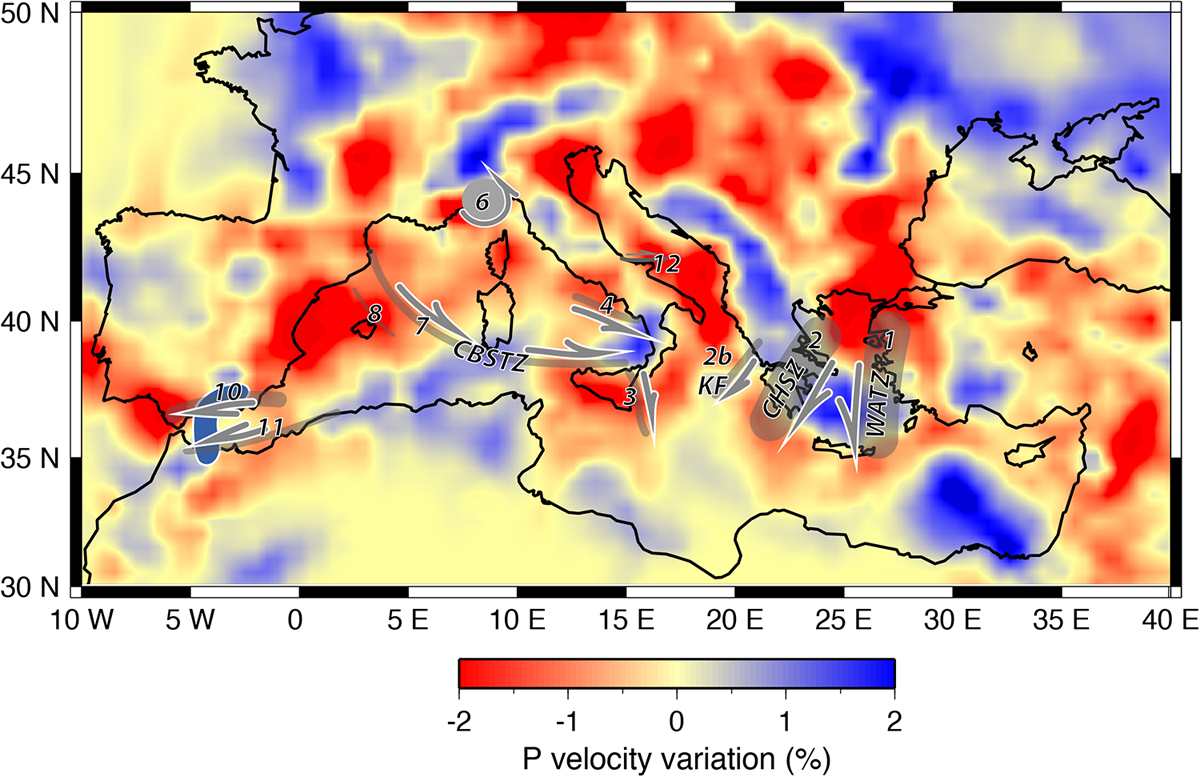
Fig. 13
Download original image
Localisation of the main discussed transfer zones on top of a P-wave tomographic model. The model is from Piromallo and Morelli (2003) and shows the average VP perturbation in the upper mantle (vertical average between 100 and 250 km), after Jolivet et al. (2009). The blue shape near Gibraltar is the VP anomaly due to the Gibraltar slab after Villaseñor et al. (2015).
Current usage metrics show cumulative count of Article Views (full-text article views including HTML views, PDF and ePub downloads, according to the available data) and Abstracts Views on Vision4Press platform.
Data correspond to usage on the plateform after 2015. The current usage metrics is available 48-96 hours after online publication and is updated daily on week days.
Initial download of the metrics may take a while.