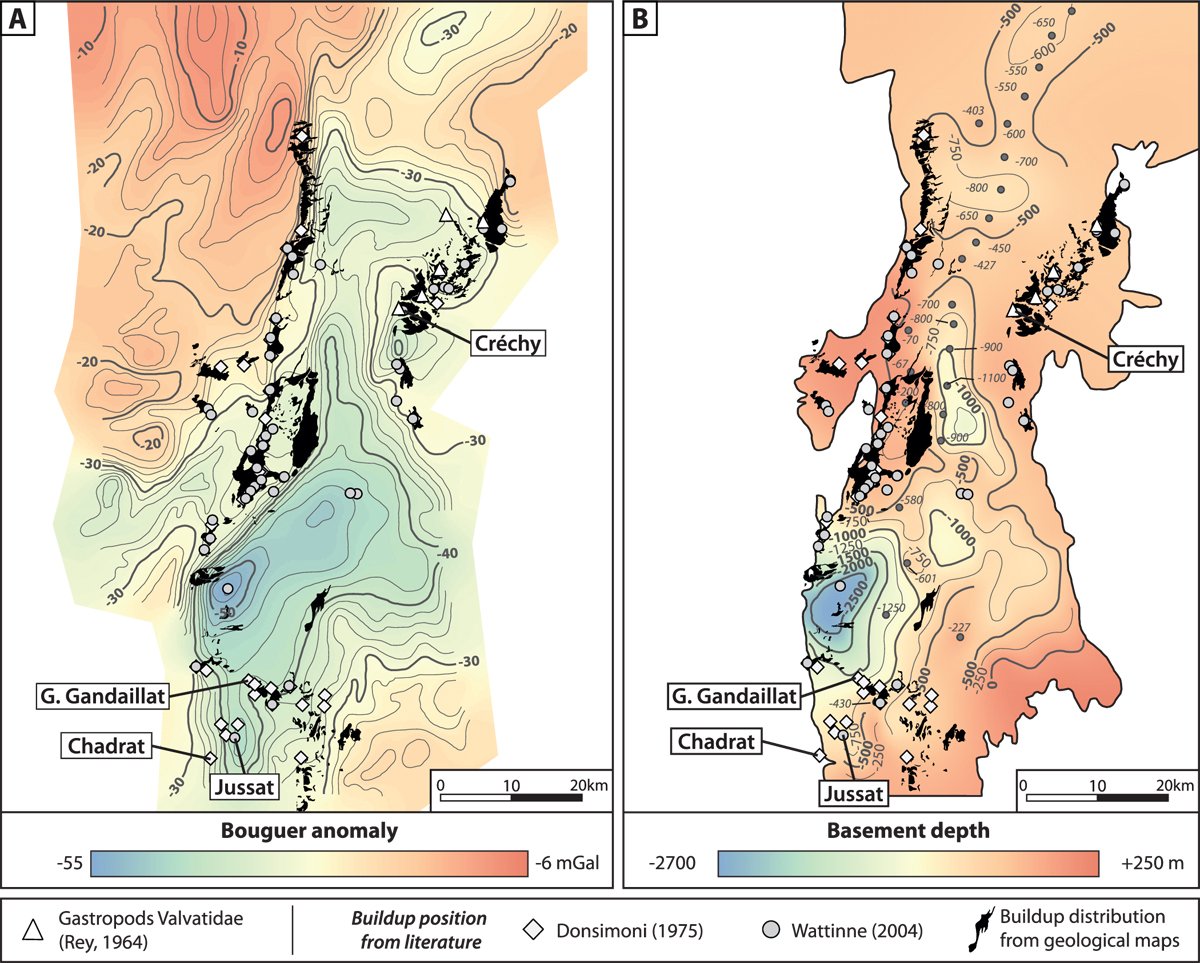
Fig. 2

Download original image
(A) Gravity (Bouguer) anomaly (in mGal) and (B) basement depth (in m below/above sea level) maps of the Limagne Basin (after Morange et al., 1971). Contour lines and point data from Morange et al. (1971) maps were interpolated into a raster map using ArcMap (“Topo to Raster” tool, applying ANUDEM (Australian National University Digital Elevation Model) program; Hutchinson, 1988, 1989) producing continuous data. The distribution of microbial and/or metazoans buildups and Valvatidae gastropods is based on literature data.
Current usage metrics show cumulative count of Article Views (full-text article views including HTML views, PDF and ePub downloads, according to the available data) and Abstracts Views on Vision4Press platform.
Data correspond to usage on the plateform after 2015. The current usage metrics is available 48-96 hours after online publication and is updated daily on week days.
Initial download of the metrics may take a while.


