")
")
Fig. 11
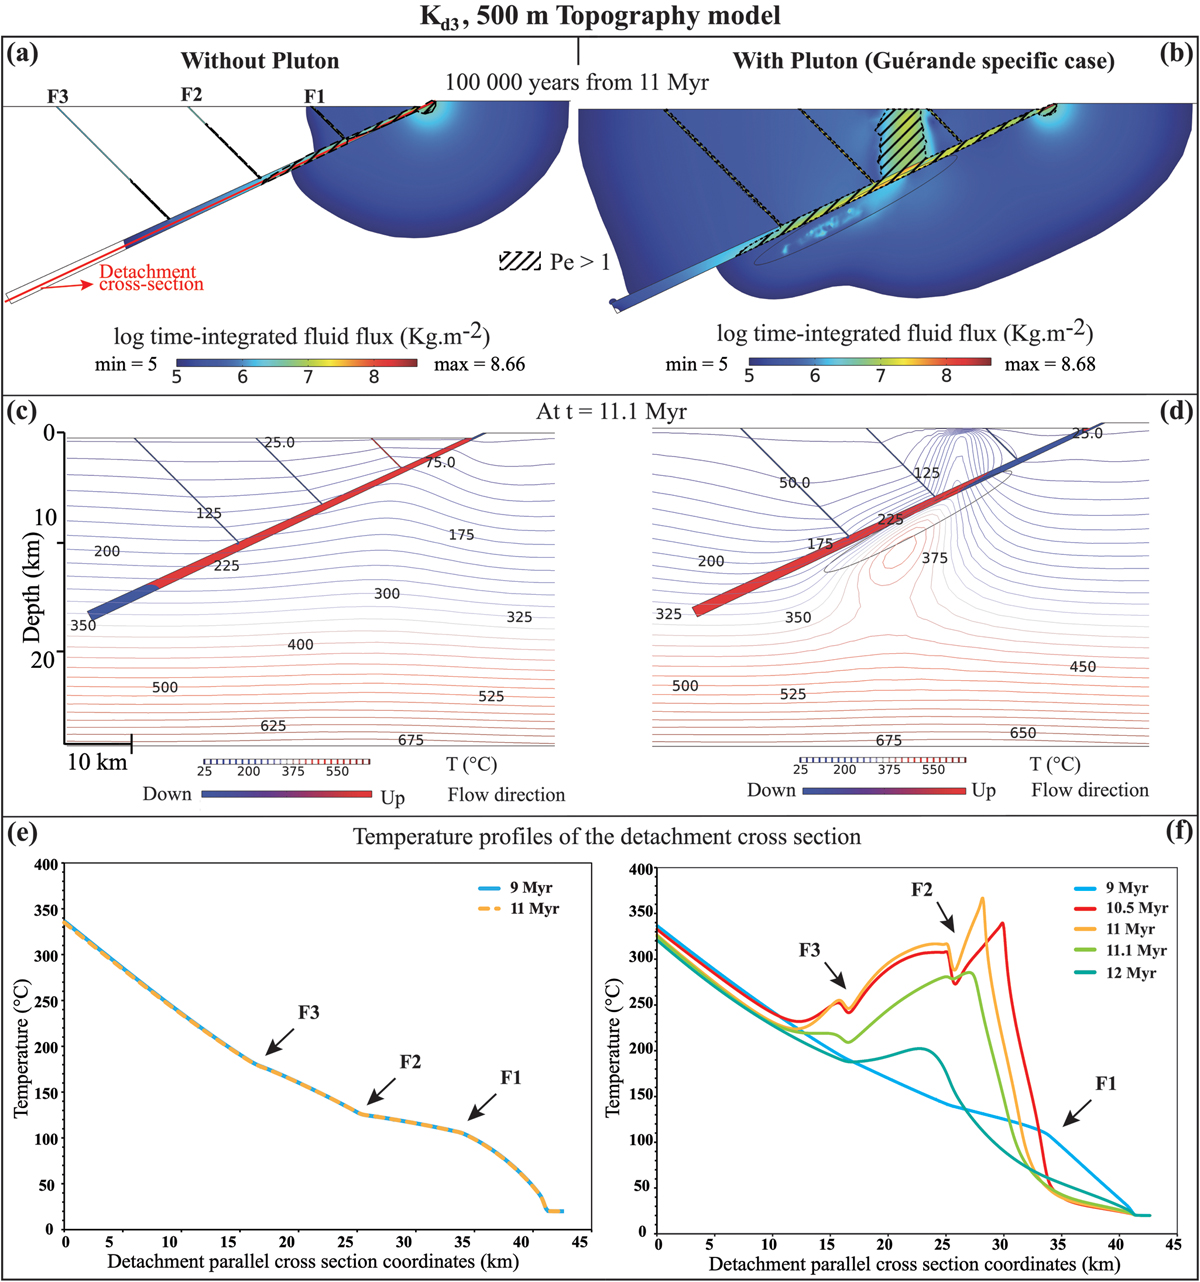
Download original image
Comparative analysis of detachment zone models with (right side) and without a syn-kinematic pluton (left side). (a) and (b) display the logarithm of time-integrated fluid flux for the two models. (c) and (d) illustrate the FPFV and isotherms. (e) and (f) present the temperature profiles across the detachment cross-section, depicted in (a).
Current usage metrics show cumulative count of Article Views (full-text article views including HTML views, PDF and ePub downloads, according to the available data) and Abstracts Views on Vision4Press platform.
Data correspond to usage on the plateform after 2015. The current usage metrics is available 48-96 hours after online publication and is updated daily on week days.
Initial download of the metrics may take a while.