")
")
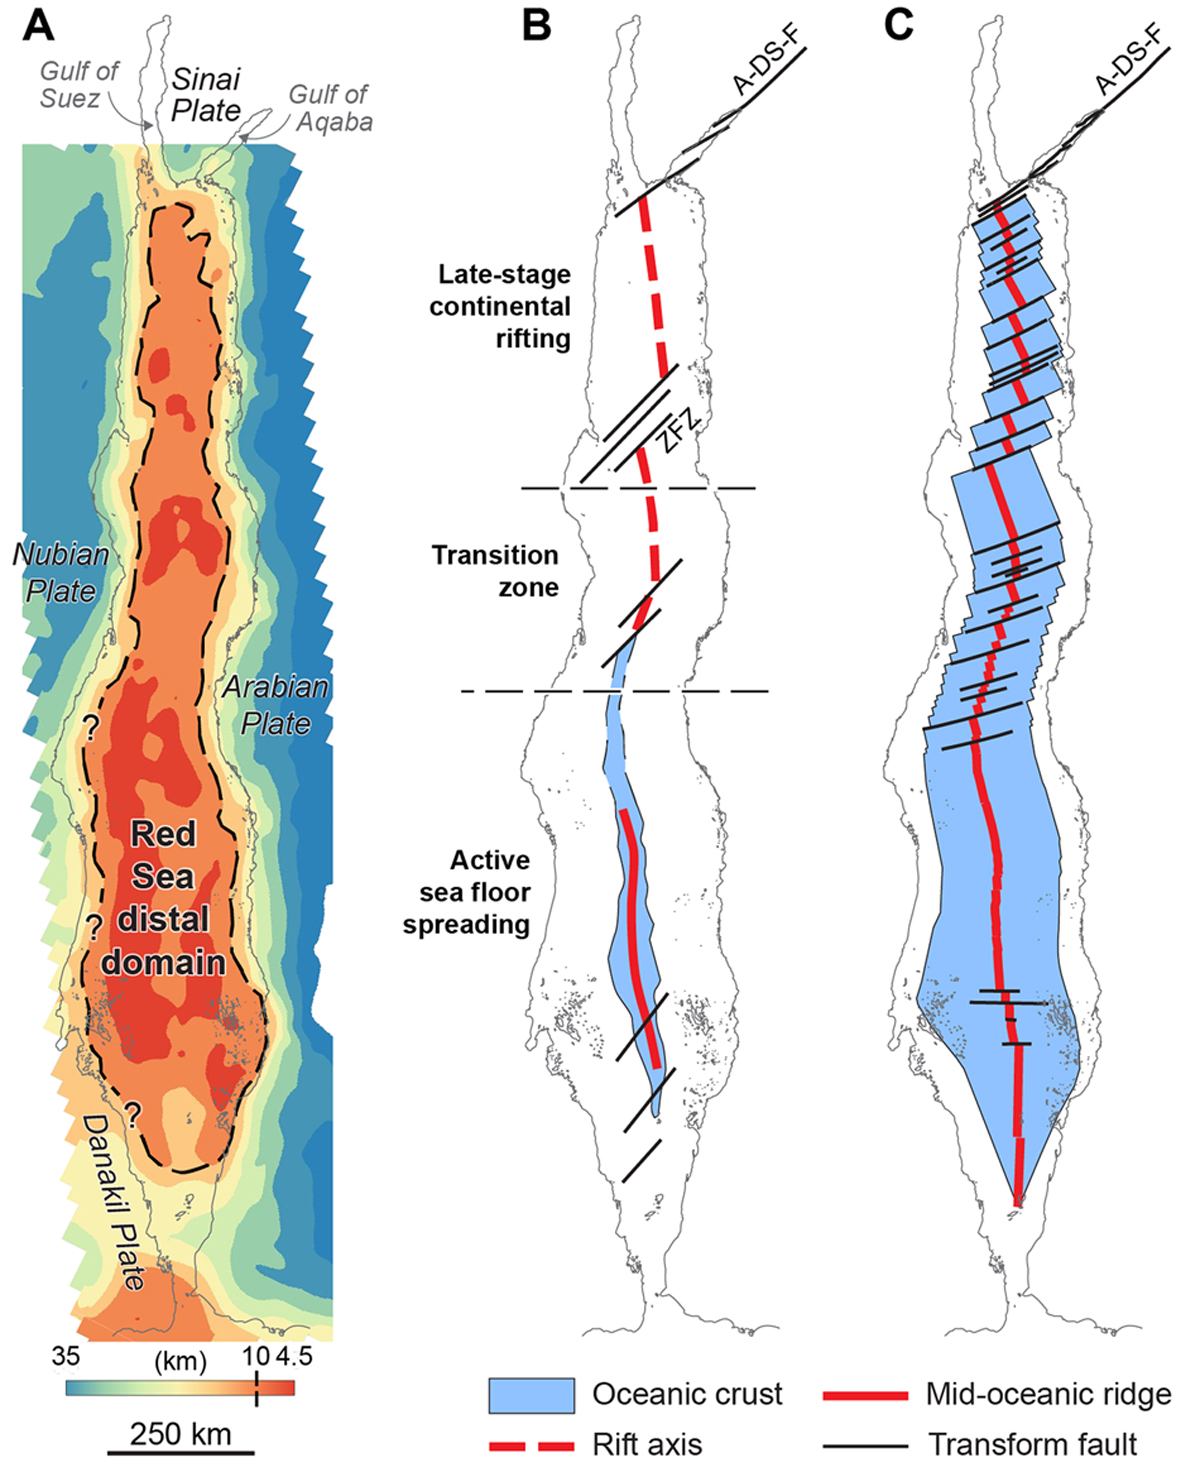
Fig. 1
Download original image
(A) Crustal thickness map constructed by subtracting the basement from the moho depth maps (Supp. Data 1C and 1D). The hatched line is the 10 km iso-thickness marking the transition between the necking and the distal domains. (B) “Mainly rift” tectonic model redrawn from Bosworth (2015). (C) Mainly ocean tectonic model redrawn from Delaunay et al. (2023). A-DS-F: Aqaba-Dead-Sea Fault; ZFZ: Zabargad Fracture Zone. Projection system: Ain el Abd 1970, Aramco, Lambert 2. Rotation: −26.75°.
Current usage metrics show cumulative count of Article Views (full-text article views including HTML views, PDF and ePub downloads, according to the available data) and Abstracts Views on Vision4Press platform.
Data correspond to usage on the plateform after 2015. The current usage metrics is available 48-96 hours after online publication and is updated daily on week days.
Initial download of the metrics may take a while.