")
")
Fig. 13
Download original image
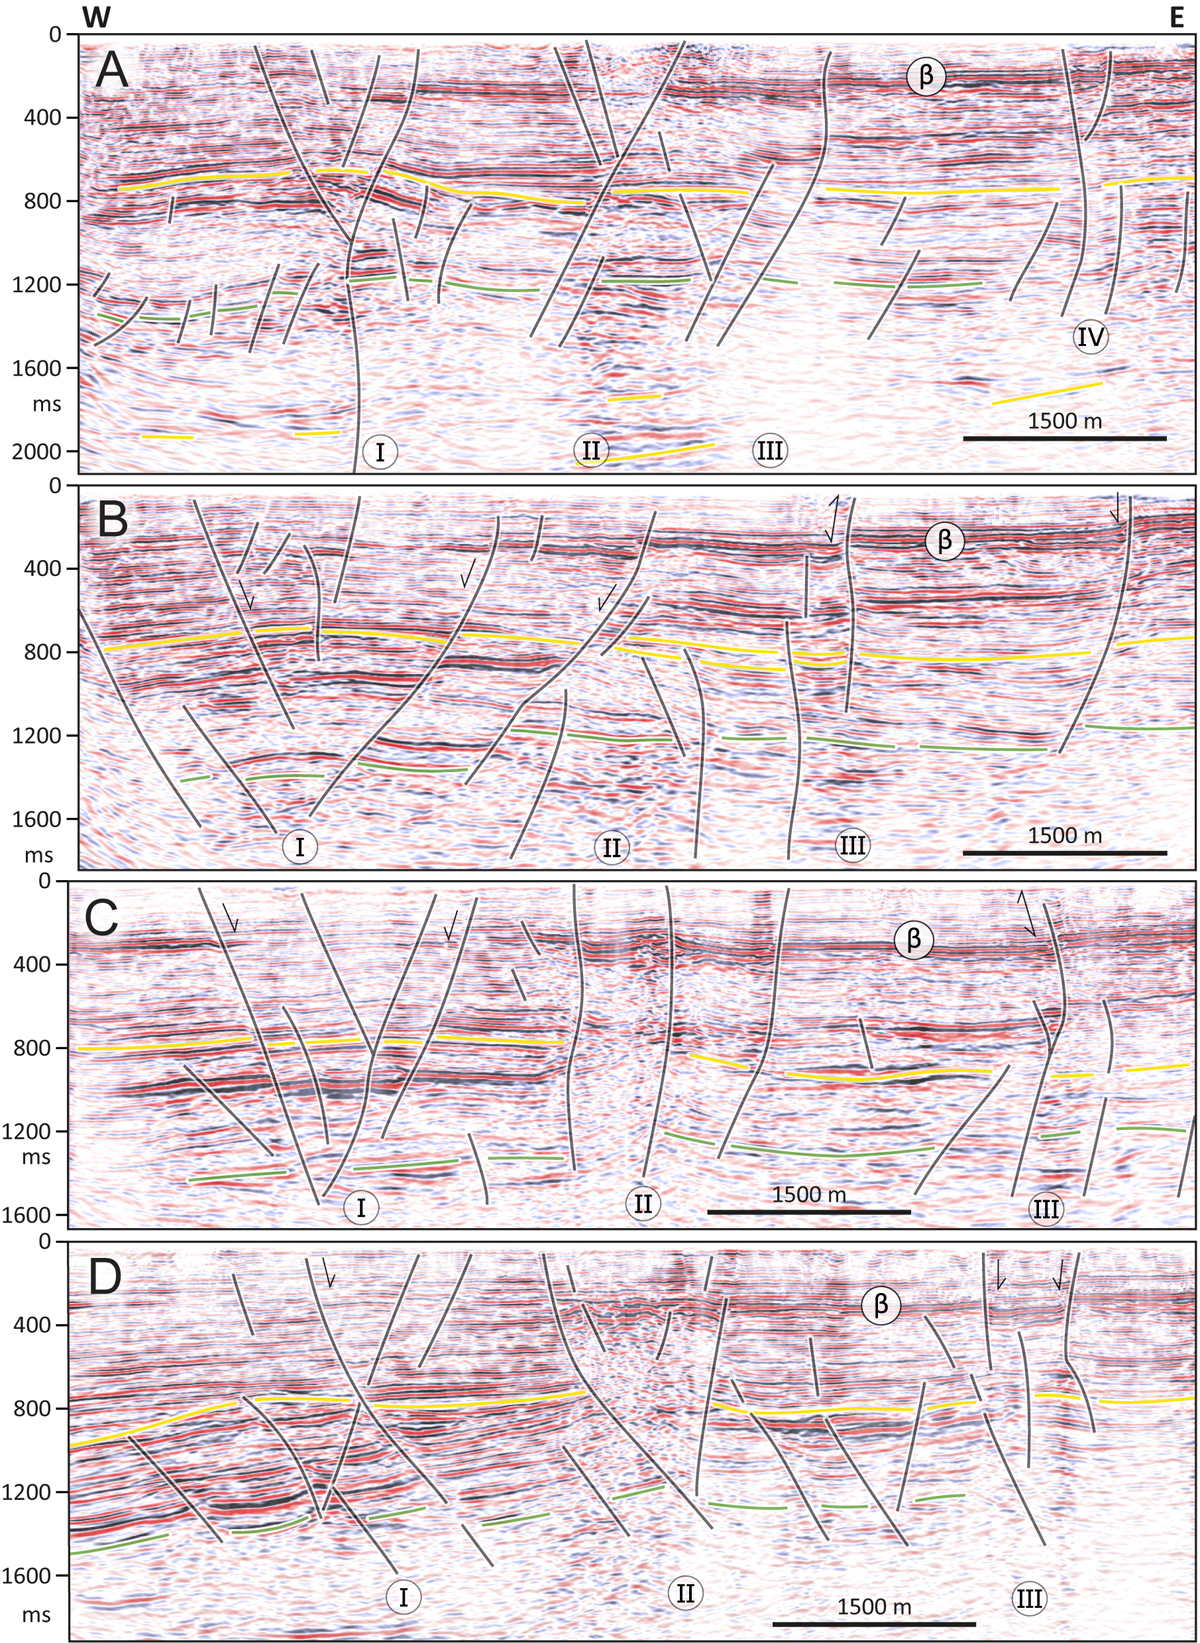
Succession from N to S of W-E seismic profiles. I, II, III and IV referred to the continuous N-S fault trends displayed on the depth structural maps (Figs. 11A and B). The Late Miocene age for the first tectonic deformations is particularly clear on profile A for trend I. The variability of faults geometry appears clearly especially for trend I. The interpretation of the flower structures as strike-slip faults is particularly convincing on trend I profile A and D and on trend II profiles A, C and D. On the trend II on line D, one notes deeming of the seismic data from the bottom to the top of the faulted zone probably linked to upward gas migration.
Current usage metrics show cumulative count of Article Views (full-text article views including HTML views, PDF and ePub downloads, according to the available data) and Abstracts Views on Vision4Press platform.
Data correspond to usage on the plateform after 2015. The current usage metrics is available 48-96 hours after online publication and is updated daily on week days.
Initial download of the metrics may take a while.