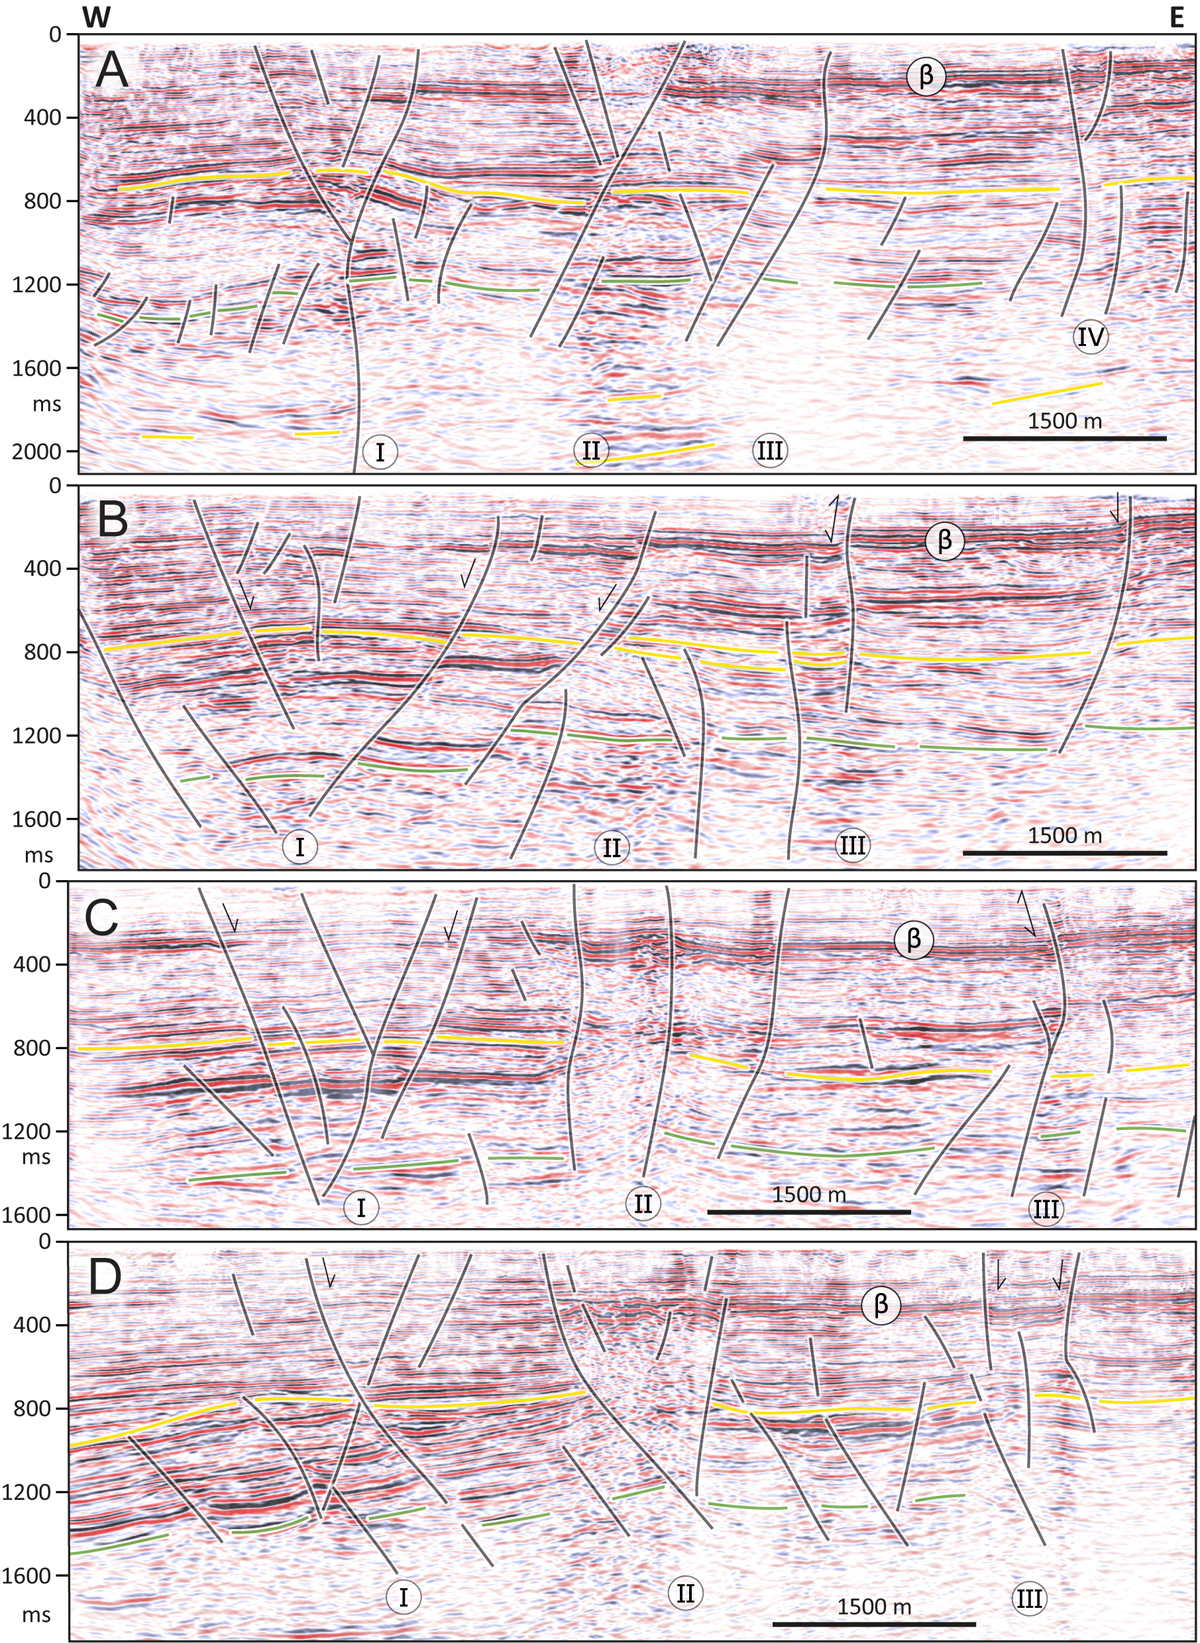
Fig. 13

Download original image
Succession from N to S of W-E seismic profiles. I, II, III and IV referred to the continuous N-S fault trends displayed on the depth structural maps (Figs. 11A and B). The Late Miocene age for the first tectonic deformations is particularly clear on profile A for trend I. The variability of faults geometry appears clearly especially for trend I. The interpretation of the flower structures as strike-slip faults is particularly convincing on trend I profile A and D and on trend II profiles A, C and D. On the trend II on line D, one notes deeming of the seismic data from the bottom to the top of the faulted zone probably linked to upward gas migration.
Les statistiques affichées correspondent au cumul d'une part des vues des résumés de l'article et d'autre part des vues et téléchargements de l'article plein-texte (PDF, Full-HTML, ePub... selon les formats disponibles) sur la platefome Vision4Press.
Les statistiques sont disponibles avec un délai de 48 à 96 heures et sont mises à jour quotidiennement en semaine.
Le chargement des statistiques peut être long.


