")
")
Open Access
Fig. 2
Download original image
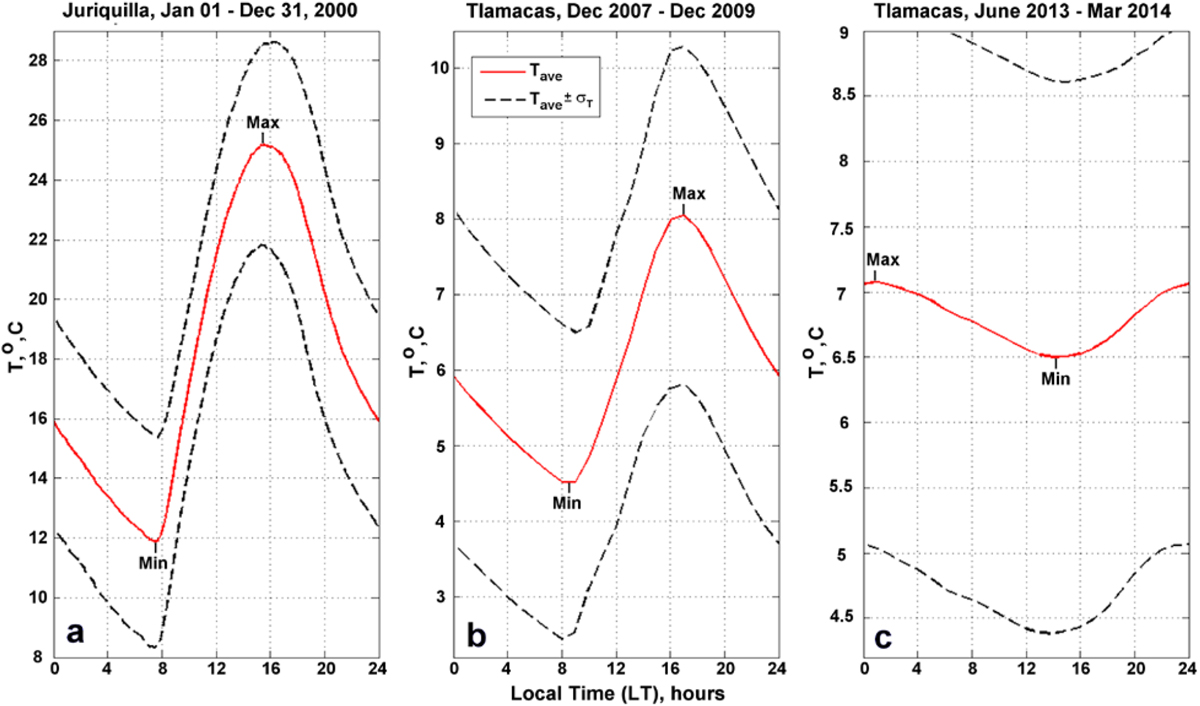
Averaged diurnal temperature in: a: Juriquilla, Querétaro, December 2007–December 2009; b: Tlamacas, December 2007–December 2009; c: Tlamacas, June 2013–March 2014. Averaged temperature Tave is drawn by solid red line, Tave ± σT (where σT is temperature dispersion over the averaged period) are drawn with dashed black lines.
Current usage metrics show cumulative count of Article Views (full-text article views including HTML views, PDF and ePub downloads, according to the available data) and Abstracts Views on Vision4Press platform.
Data correspond to usage on the plateform after 2015. The current usage metrics is available 48-96 hours after online publication and is updated daily on week days.
Initial download of the metrics may take a while.