")
")
Open Access
Fig. 4
Download original image
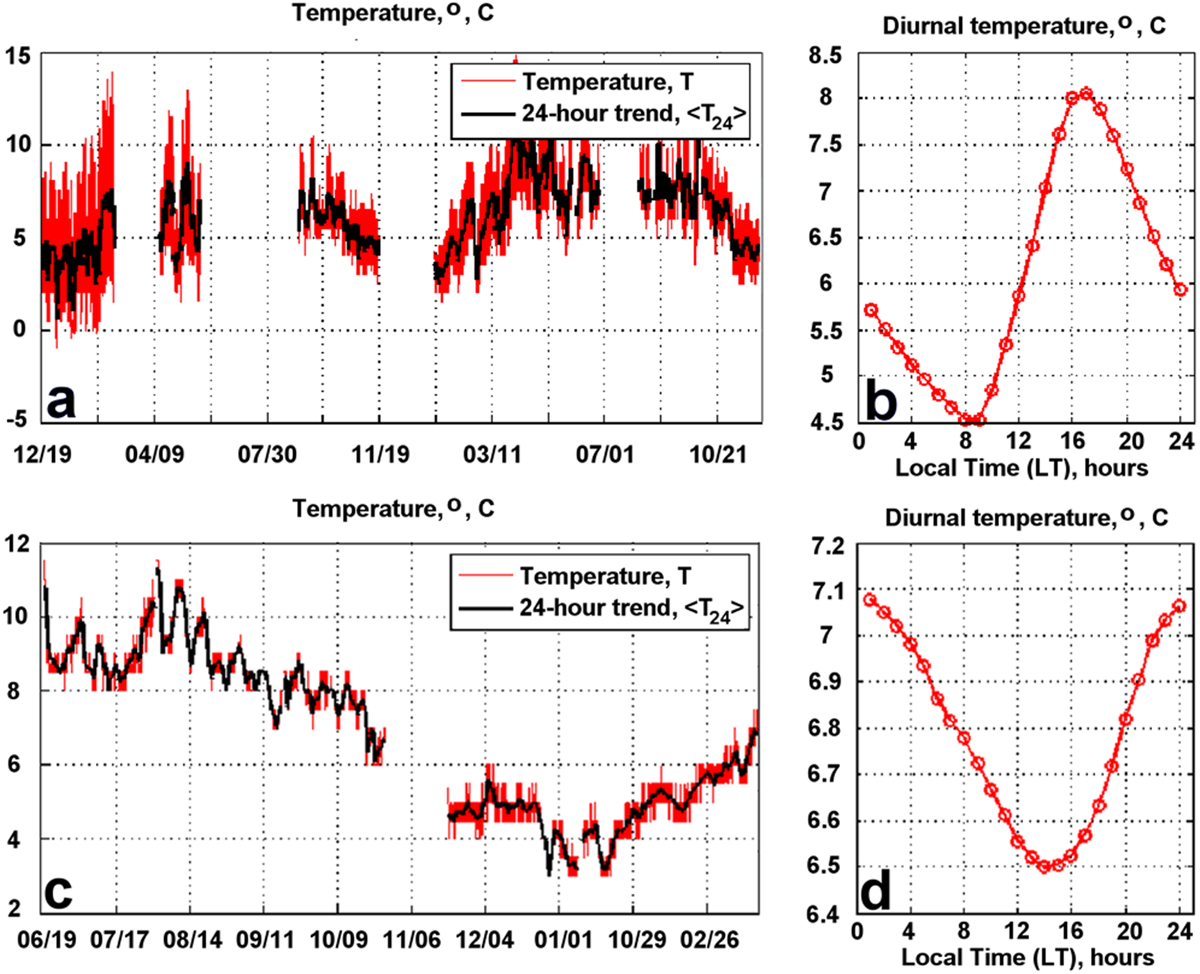
Temperature variation during measurements Dec 2007–Dec 2009 (a) and Jun 2013–Mar 2014 (c) and averaged diurnal variations (b, d), respectively. Data format is dd/mm for graphs (a, c).
Current usage metrics show cumulative count of Article Views (full-text article views including HTML views, PDF and ePub downloads, according to the available data) and Abstracts Views on Vision4Press platform.
Data correspond to usage on the plateform after 2015. The current usage metrics is available 48-96 hours after online publication and is updated daily on week days.
Initial download of the metrics may take a while.