")
")
Fig. 8
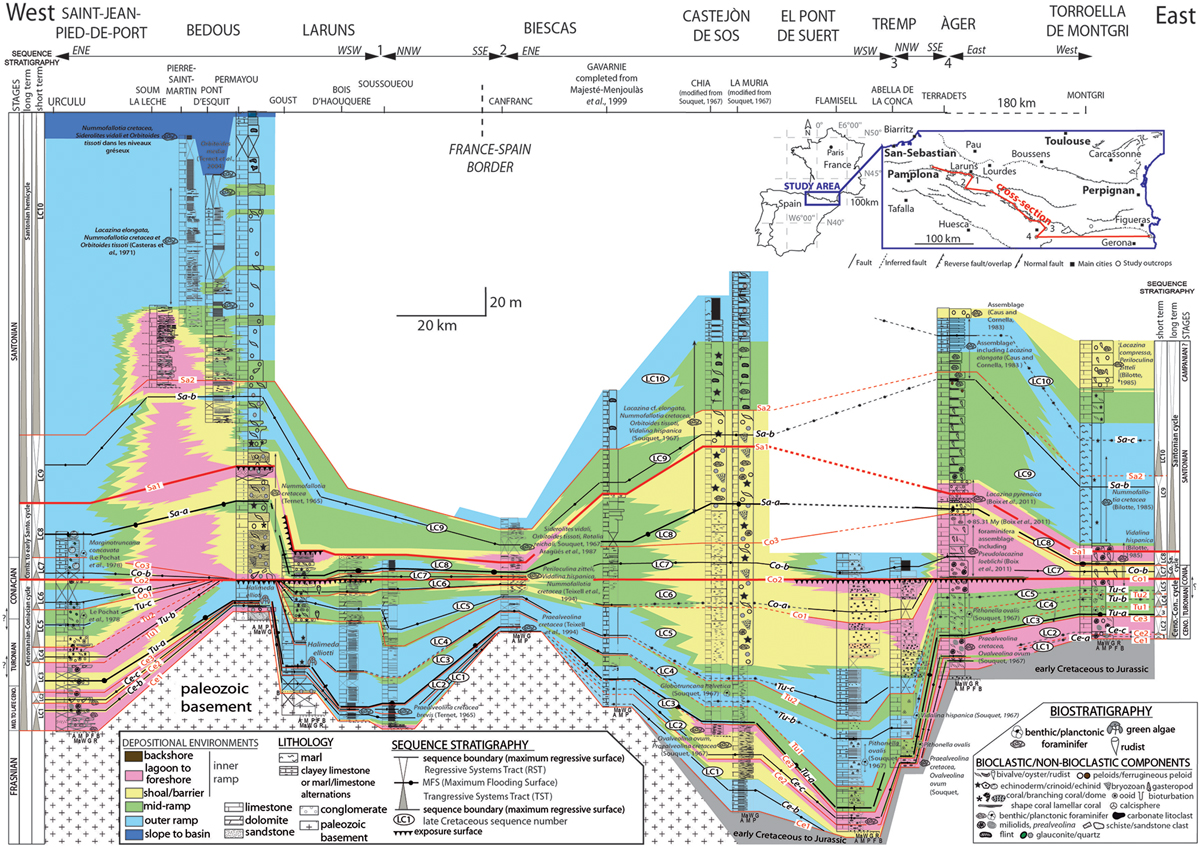
Download original image
Correlation diagram of Cenomanian to Santonian sections along the transect of this study. This diagram incorporates 14 outcrop sections examined in this study and 2 sections modified from Souquet (1967) (Chià and la Muria; locations in Fig. 1). Correlations are based on biostratigraphy (Fig. 3) and 10 recognized stratigraphic cycles (LC1 to LC10) delimited by maximum regressive surfaces (Ce1 to Sa2).
Current usage metrics show cumulative count of Article Views (full-text article views including HTML views, PDF and ePub downloads, according to the available data) and Abstracts Views on Vision4Press platform.
Data correspond to usage on the plateform after 2015. The current usage metrics is available 48-96 hours after online publication and is updated daily on week days.
Initial download of the metrics may take a while.