")
")
Fig. 3
Download original image
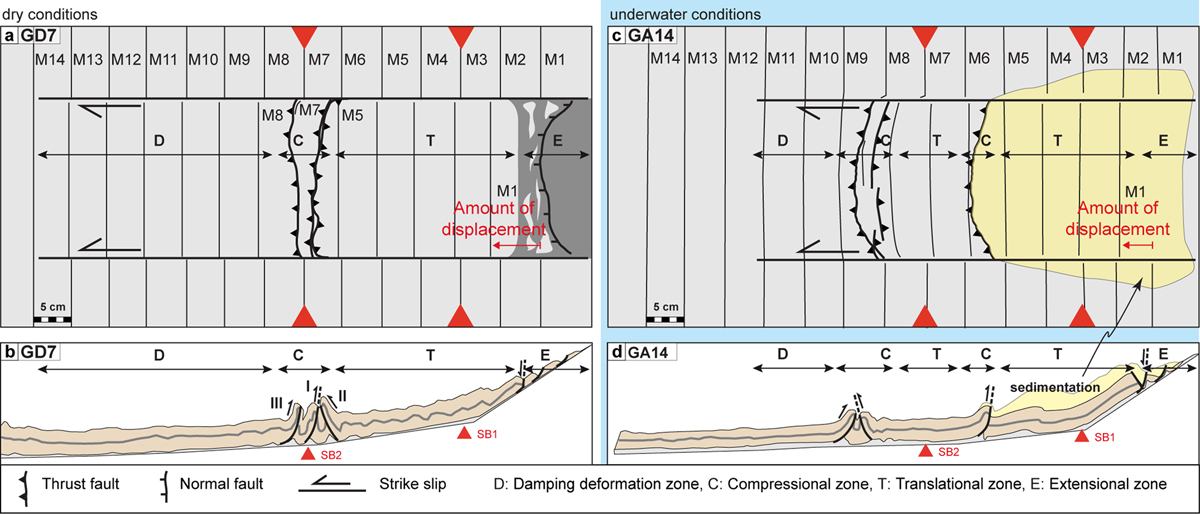
Examples of the final results obtained in the models. (a,b) Dry experiment GD7 without additional sand input. (c,d) Aqueous experiment GA 14 with additional sand input. Interpretative drawings of (a,c) the final surface views and (b,d) the cross-sections. E, T, C and D denote the deformation zones in the surface view (E: extension, T: translation, C: compression, D: damage); the final displacement of marker M1 is also highlighted. I, II and III indicate the order in which the faults spear on the cross-section. The vertical exaggeration in the cross-sections is x4.4.
Current usage metrics show cumulative count of Article Views (full-text article views including HTML views, PDF and ePub downloads, according to the available data) and Abstracts Views on Vision4Press platform.
Data correspond to usage on the plateform after 2015. The current usage metrics is available 48-96 hours after online publication and is updated daily on week days.
Initial download of the metrics may take a while.