")
")
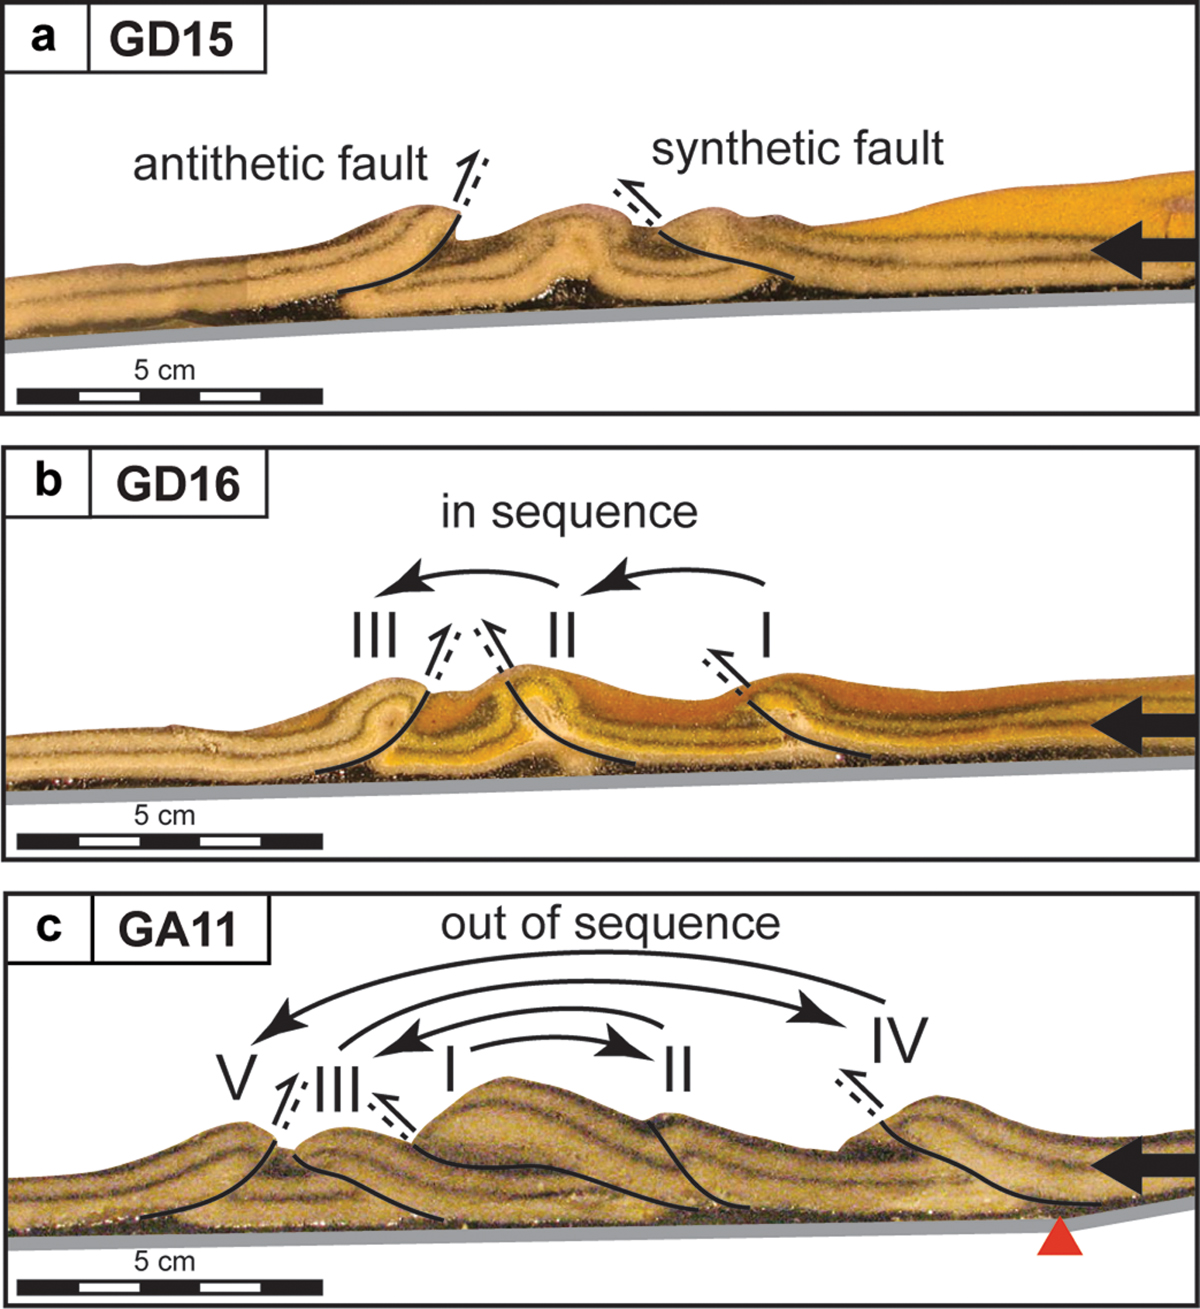
Fig. 4
Download original image
Details of the final axial sections across the morphological fronts for the GD15, GA15 and GA11 experiments. The roman numerals indicate the order in which the faults appear. (a) Illustration of a synthetic versus an antithetic fault. (b) Illustration of faults formed in sequence. (c) Illustration of faults formed out of sequence. The black arrows on the right-hand side indicate the sliding direction. The roman numerals give the order of occurrence of the faults.
Current usage metrics show cumulative count of Article Views (full-text article views including HTML views, PDF and ePub downloads, according to the available data) and Abstracts Views on Vision4Press platform.
Data correspond to usage on the plateform after 2015. The current usage metrics is available 48-96 hours after online publication and is updated daily on week days.
Initial download of the metrics may take a while.