")
")
Open Access
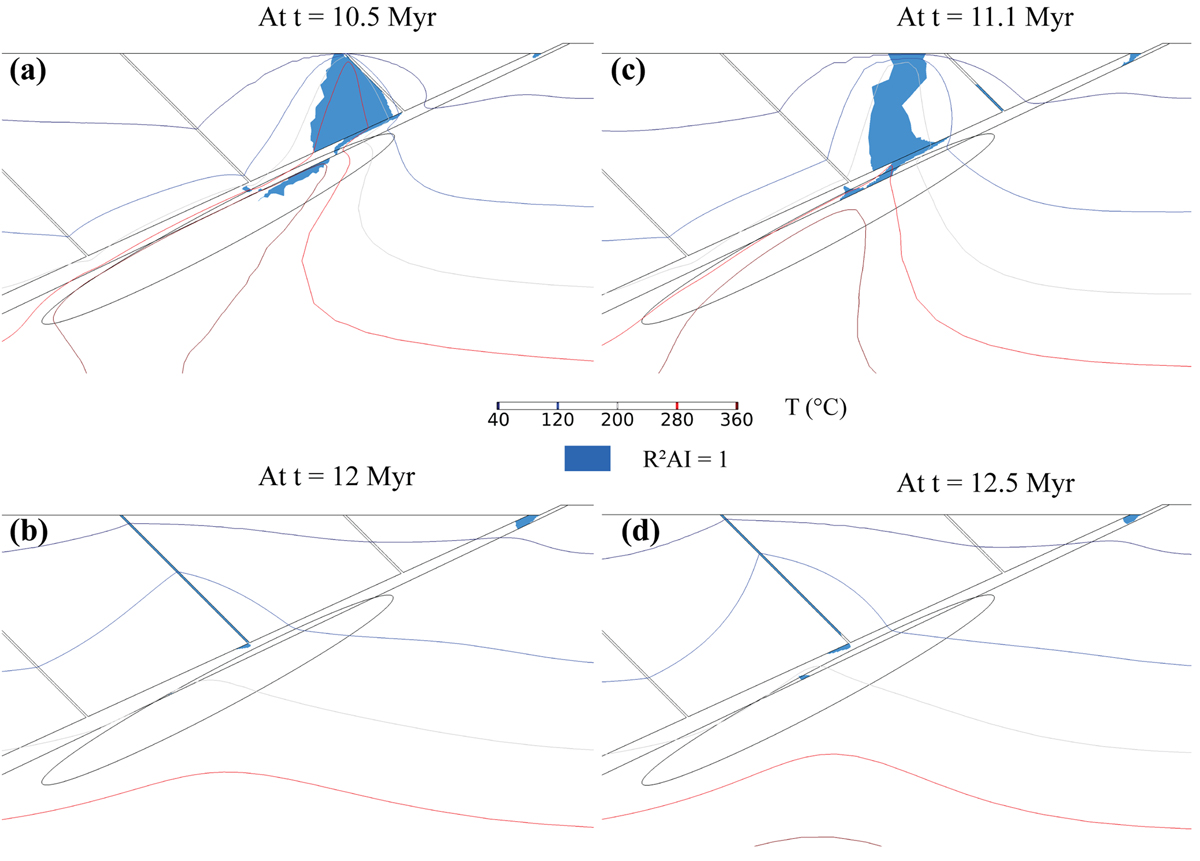
Fig. 14
Download original image
Mapping of potential mineralization zones on the application case of the Guérande U mineralized system through the Restricted Rock Alteration Index (R2AI) at four distinct stages during the activation and cooling phases. Blue arrows indicate downward fluid flow and red arrows indicate upward fluid flow.
Current usage metrics show cumulative count of Article Views (full-text article views including HTML views, PDF and ePub downloads, according to the available data) and Abstracts Views on Vision4Press platform.
Data correspond to usage on the plateform after 2015. The current usage metrics is available 48-96 hours after online publication and is updated daily on week days.
Initial download of the metrics may take a while.