")
")
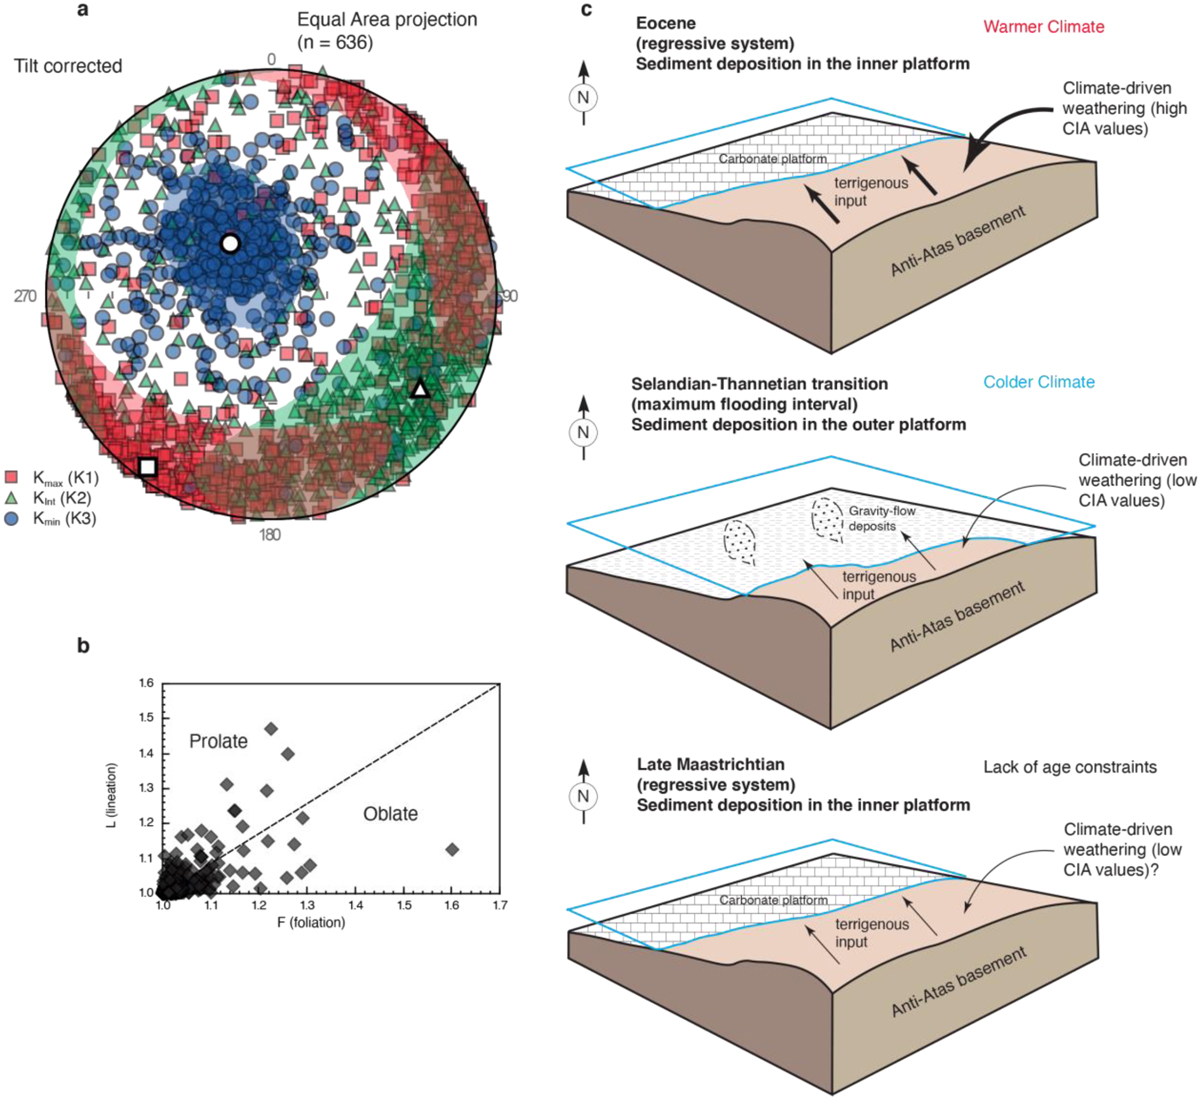
Fig. 8
Download original image
(a) Data plotted on a lower hemisphere stereonet projection showing the magnetic grain fabric. This projection derives from the AMS ellipsoid (for a comprehensive illustration see Zhang et al. (2010) and Bilardello (2021). Kmin is vertical and Kmax and Kint axes are randomly distributed within the horizontal plane, which indicates deposition of particles under gravity only. (b) Flinn diagram (Flinn, 1978) of AMS data showing a minimum degree of anisotropy due to the presence of both oblate (disk-shaped) and prolate (rod-shaped) particles. (c) 3D paleogeographic model illustrating the weathering intensity that controls the magnetic mineral proportions between the late Maastrichtian and Eocene. In this study, sea level changes and MS vary independently. Both phyllosilicates and ferromagnetic minerals likely contribute to the MS signal.
Current usage metrics show cumulative count of Article Views (full-text article views including HTML views, PDF and ePub downloads, according to the available data) and Abstracts Views on Vision4Press platform.
Data correspond to usage on the plateform after 2015. The current usage metrics is available 48-96 hours after online publication and is updated daily on week days.
Initial download of the metrics may take a while.